GICS Industry ClassificationInteractive Concept Map
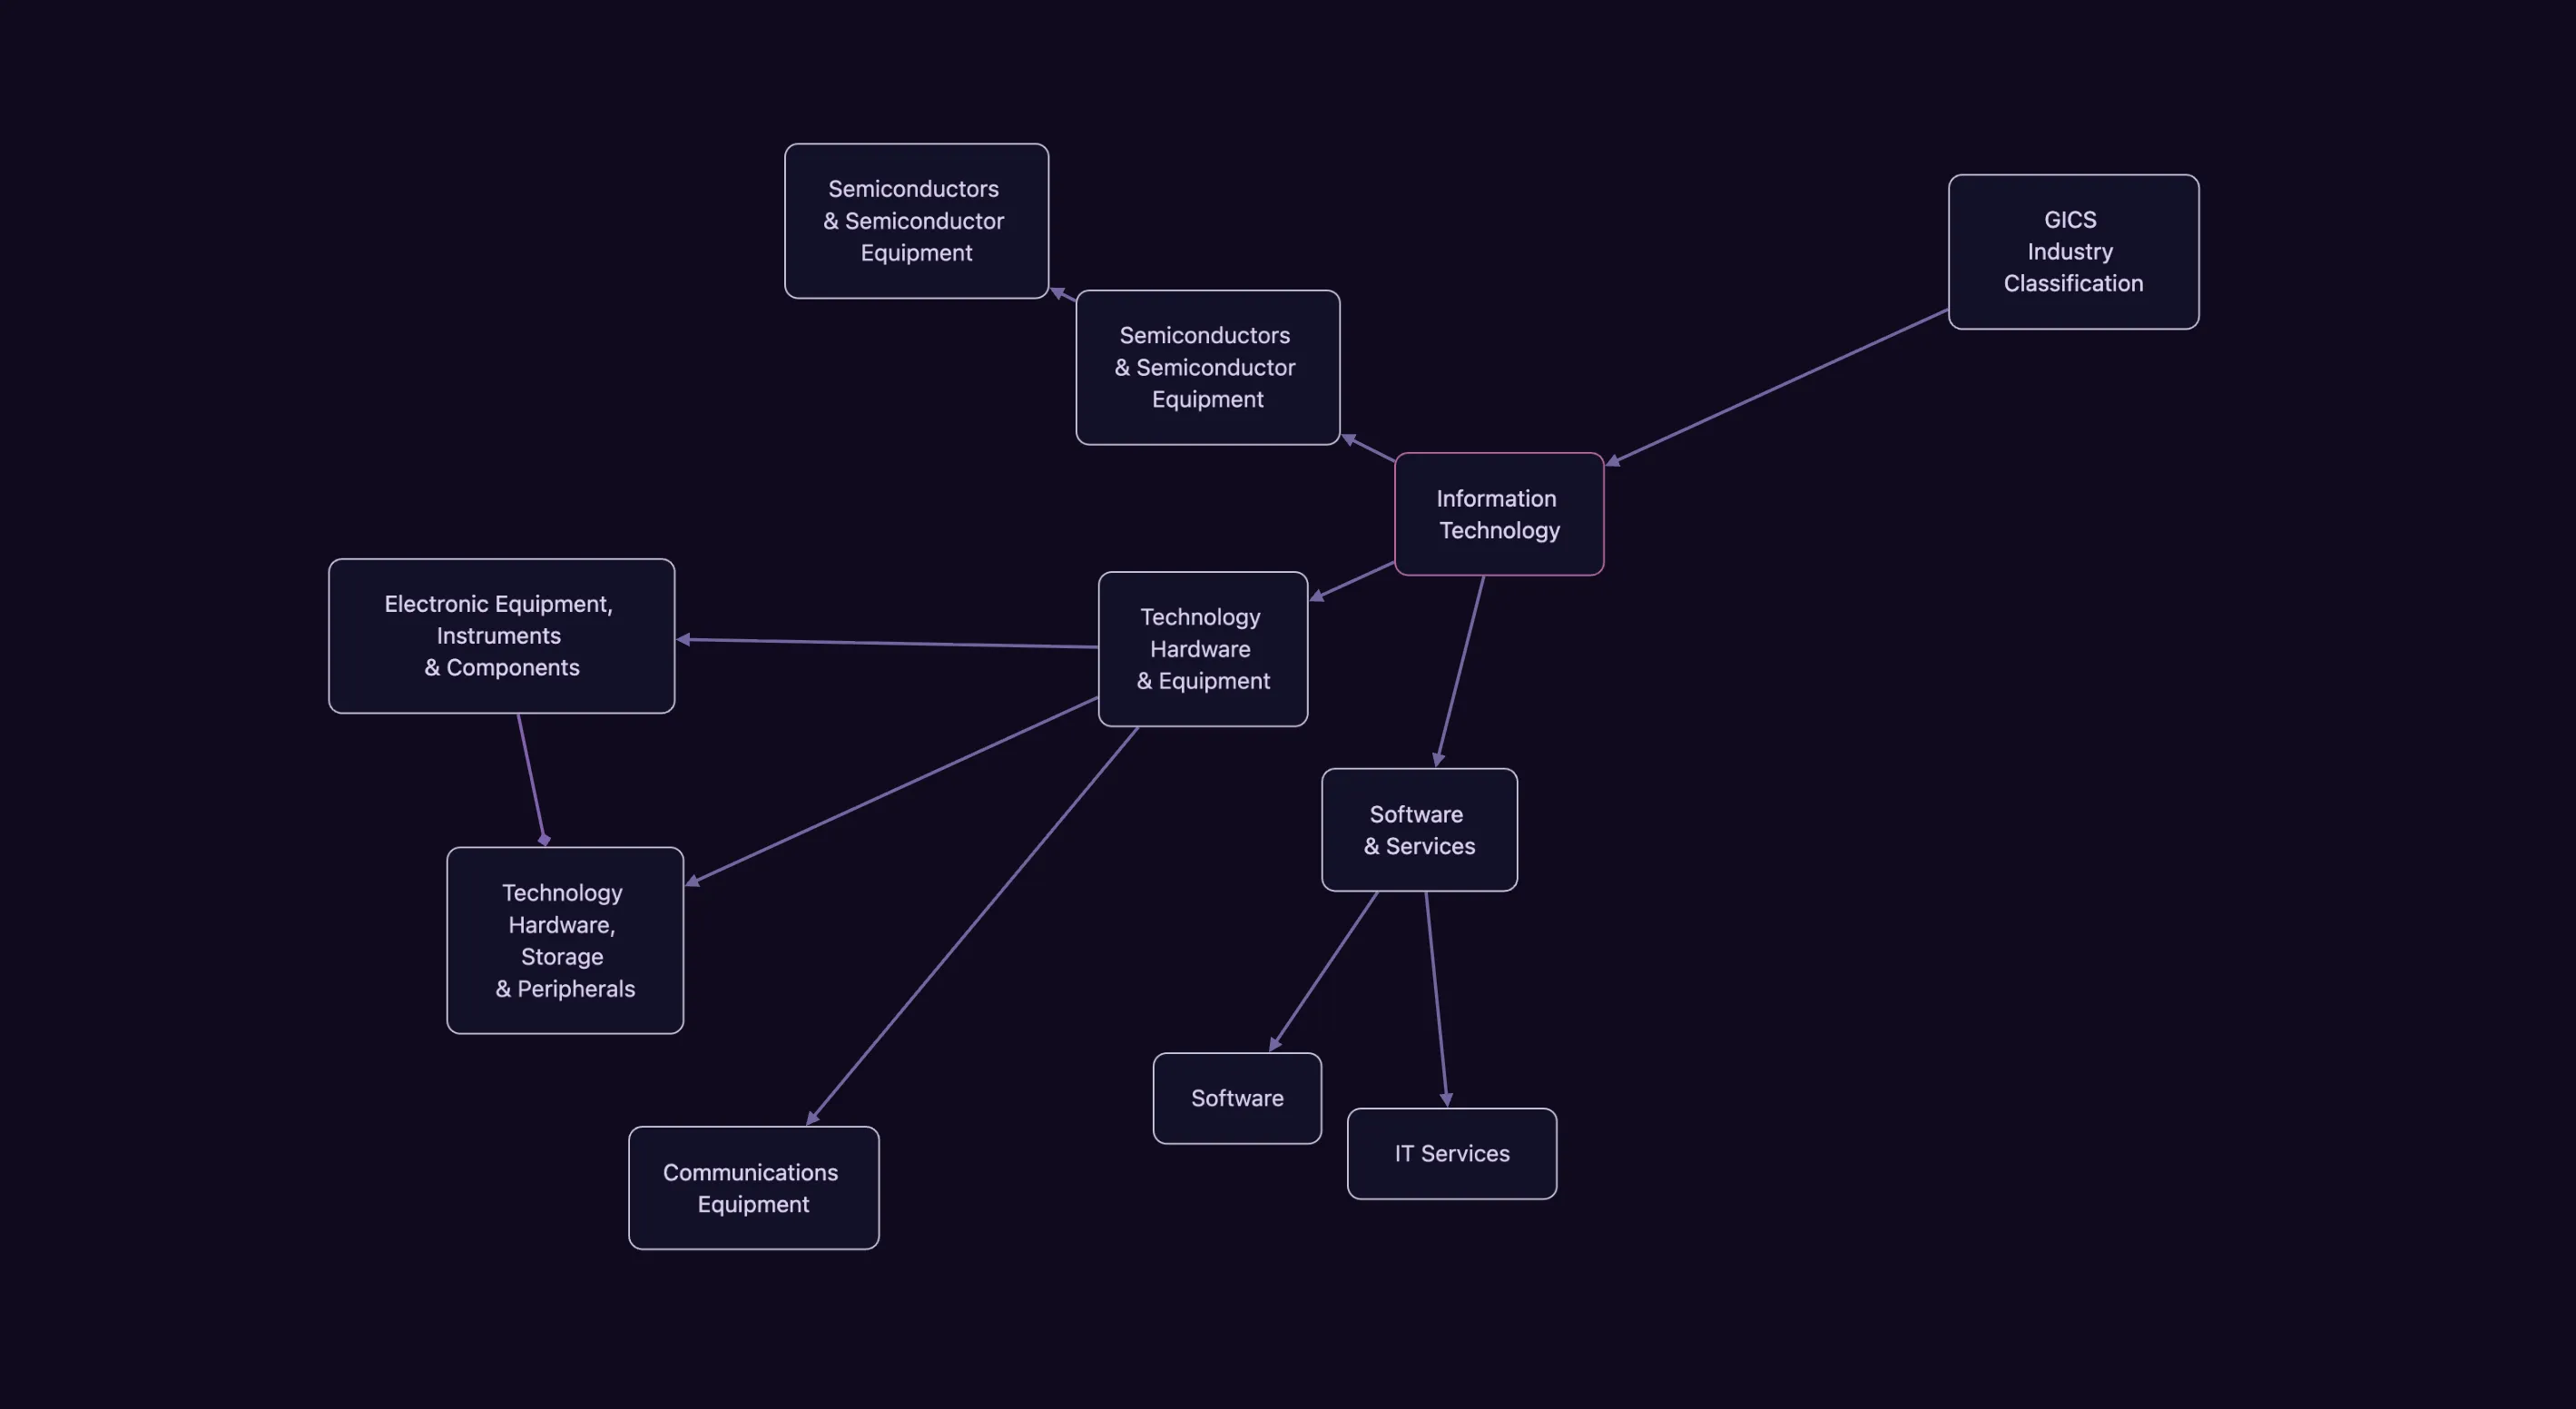
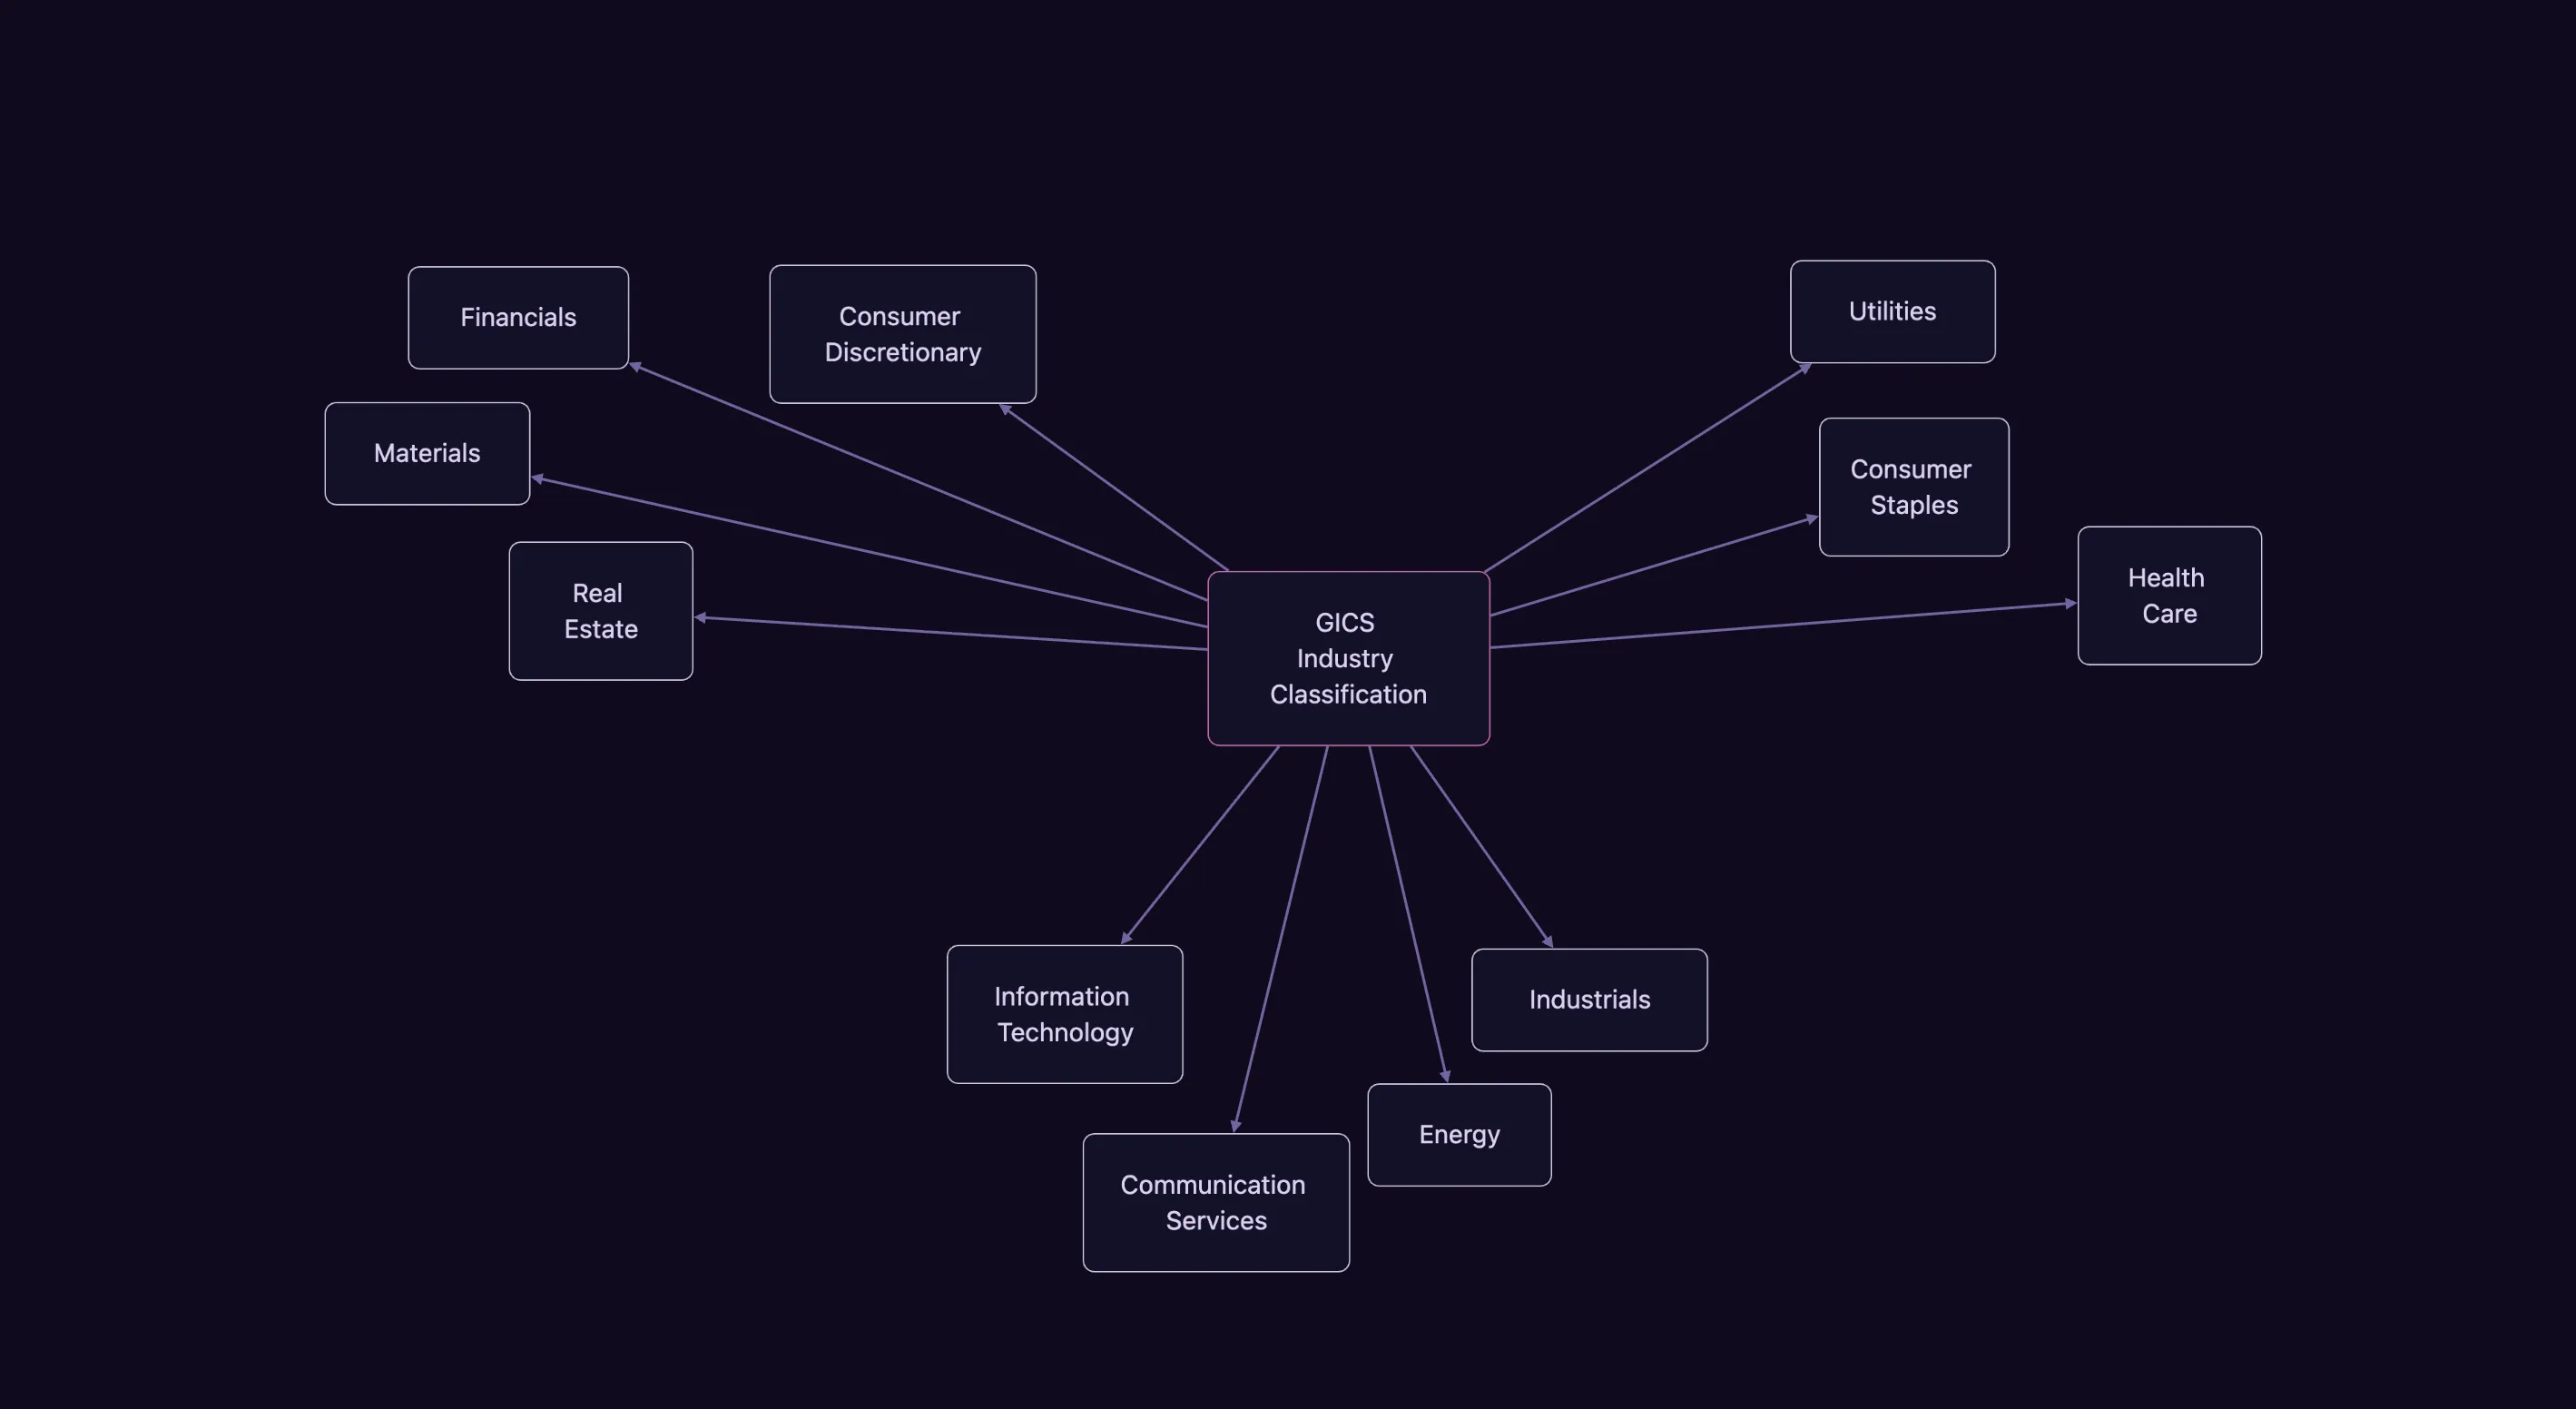
The full GICS hierarchy as a navigable tree — eleven sectors branching down through industry groups and industries to the eight-digit sub-industries, every node carrying its code. The classification that index construction and sector analysis are built on, laid out so you can see what sits beside what instead of looking up one code at a time.
Opens in the browser — no account, nothing to install. Yours to edit once it's open,
or download the file to keep.
Graphs are built for a large screen — open this one on a desktop computer.
You use these labels constantly. A tech stock, a consumer staple, rotating out of discretionary
and into utilities — the vocabulary of every market conversation and every fund factsheet. And
almost nobody who uses it daily has actually seen the thing it comes from. GICS ships as a PDF
and a spreadsheet of numbers, so you look up the one code you need, get your answer, and close
the file. The structure stays invisible.
Here it is with the structure visible. Eleven sectors at the top, each opening into industry
groups, then industries, then the eight-digit sub-industries where the real precision lives, with
the GICS code on every node so it lines up with whatever dataset you are working against. Four
levels is not deep for a taxonomy, but it is more than enough to get lost in as a flat list, and
it is exactly the depth a map handles well.
The interesting part of any classification is its edges, and edges are what a tree of nested
bullet points hides. Open a sub-industry here and its siblings are right there — the things the
committee decided were nearly this but not quite. That is where the judgement calls live, and
where the arguments have always been: Real Estate cut loose from Financials in 2016,
Communication Services assembled in 2018 out of pieces that had been telecoms, media and
technology. Neither decision makes much sense as a line in a changelog. Both are obvious the
moment you can see the neighbourhood.
It is the structure as of the March 2023 revision, and it is structure only — no constituents, no
tickers, no company assignments, which change far too often to freeze into a graph. Open it beside
your own holdings or your own dataset and annotate as you go: this is a reference map that expects
to be marked up.
What's in this graph
The map opens on GICS Industry Classification. These are the concepts branching from it — open one to
see the concepts inside it.
written article or notes
Industrials
GICS code: 20
3 children · 14 grandchildren · 4 neighbours
Capital Goods
GICS code: 2010
7 children: Machinery, Aerospace & Defense, Electrical Equipment, Building Products, Construction & Engineering …
5 children: Metals & Mining, Chemicals, Construction Materials, Containers & Packaging, Paper & Forest Products
32 grandchildren · 6 neighbours
Utilities
GICS code: 55
1 child · 5 grandchildren · 2 neighbours
Utilities
GICS code: 5510
5 children: Electric Utilities, Independent Power and Renewable Electricity Producers, Gas Utilities, Multi-Utilities, Water Utilities
8 grandchildren · 6 neighbours
… and 1 more branching from GICS Industry Classification
The shape of this map
A tree linking 301 ideas would need 300
connections. This map has 366. The extra 66 give some ideas more than one route in.
The map runs 5 levels deep from its root. Any two ideas are about 6.2 steps apart, and the two most distant are 10.
Neighbouring ideas are linked to each other 5% of the time — the map branches outward rather than weaving back on itself.
Connections are typed, not plain lines. They come in 3 kinds: Consists of, Supplies to, Classifies.
Most routes through the map pass through Consumer Discretionary, Financials, Industrials, Real Estate, Chemicals, Equity Real Estate Investment Trusts (REITs).
One node from the map
GICS Industry Classification
The Global Industry Classification Standard (GICS) is the taxonomy by which global finance organizes the corporate world. Developed jointly by MSCI and S&P in 1999, it assigns every public company a place in a four-tier hierarchy according to what the company actually does. Before GICS, industry classification was fragmented across national schemes built for government statistics rather than investing; as portfolios became global, investors needed one consistent language for comparing companies across countries. GICS was designed as that language, and it won: today it underlies the S&P and MSCI index families and covers the overwhelming majority of global equity market capitalization.
GICS classifies at four levels of increasing precision: 11 sectors, 25 industry groups, 74 industries, and 163 sub-industries. The tiers nest strictly — each sub-industry belongs to exactly one industry, each industry to one group, each group to one sector. The coding system mirrors the nesting: sectors carry two-digit codes (10 Energy, 45 Information Technology), and each deeper tier appends two digits, so the eight-digit sub-industry code 45301020 Semiconductors contains its entire ancestry.
Each company receives exactly one classification, assigned at the most granular tier and inherited upward. The deciding criterion is the company's principal business activity, measured primarily by revenue, with earnings and market perception as secondary considerations. The rule is deliberately mechanical: Amazon sits in Broadline Retail, not Information Technology, because retail is where its revenue comes from — cloud computing notwithstanding. To limit churn, a reclassification is generally considered only when a different activity reaches roughly 60% of revenues. Classifications are monitored continuously for corporate actions and formally reviewed each year. …
This continues inside the graph, along with 300 other nodes.