A large graph is hard to navigate all at once — so Knogra lets you break it into focused views, each scoped to what matters right now. They all draw from one connected graph, and keeping one tidy takes a click rather than an afternoon. Complexity stays manageable no matter how far your knowledge grows.
Transitions
Moving between scenes is animated — shared ideas drift to their new positions rather than the screen jumping to something unrelated. Your brain encodes knowledge spatially: you remember a concept by where it sat and how you reached it. Knogra turns navigation into memory.
Helicopter View
Scenes are the ground view; the Helicopter view is the map above them, built automatically from the graph itself. Any concept at the centre, its neighbours around it, theirs beyond. Every connection keeps one fixed direction wherever you are, so moving from concept to concept never turns the map: what you came from is still behind you.
Topology-Aware AI
The assistant reads your graph — nodes and connections both — so it understands what you're building, not just what you typed. Each concept keeps its own conversation on the node, carrying only the context that concept needs: nothing gets buried in a scroll-back, and you aren't paying to resend a whole history with every question. Ask it to grow the map and it suggests nodes to add and connections you'd missed.
No Design Tax
Appearance should emerge from understanding, not from a separate act of design. As you work out what an idea is and how it relates to the rest, the map takes on a form that means something — legibility arrives as a side effect of getting it right. The usual bargain, where a presentable map costs an evening you meant to spend learning, simply doesn't apply here.
Node Visuals
A node is not a box with a label in it. It's a visual object you can shape, colour and lay out, with an equation rendered in its body or an SVG illustration inside it. Knowledge you recognise at a glance instead of reading word by word — 20+ presets to start from.
Note-Taking
Most notes apps add a graph view to a pile of documents. Knogra starts from the graph, and every concept carries its own notebook: prose, LaTeX, pictures uploaded, found on Wikimedia or drawn by an image model from your description, and its own conversation with the assistant. Nothing is filed in a folder or buried in a scroll-back. A note sits on the idea it is about, and is saved with the graph.
Paths
A graph has no beginning and no end — which is exactly the problem when you need to revise for something, or take another person through it. Any route through the scenes can be saved as a path: capture the one you wandered, or compose one deliberately. Then reorder it, add stops, drop what turned out irrelevant, and reopen it whenever you need that line through the map again.
Quiz Mode
Switch to quiz mode, hide a share of the nodes, and find out how much of the map you can actually reconstruct. Simple, and surprisingly effective — recalling a structure turns out to be a very different thing from having read it.
Markdown & Mermaid Import / Export
Already have diagrams in Mermaid? Import a Markdown file and the diagram inside it becomes navigable, drill-down scenes — along with the comments, equations and notes that travelled with it. Export any graph back out to share or version it. Your existing documents get a second life.
These graphs aren’t just for reading. Each one is a live workspace: open it and it’s yours to edit, expand, and reshape — add nodes, redraw connections, split scenes, fold in your own notes, or grow a demo into a map built for your own study, research, or work. Explore to get the idea, then dive in and make a graph your own. New to Knogra? Start with the step-by-step basics guide.
Every graph was composed by a person — the structure, the choices about what sits next to what, the notes. Where the AI answered, it answered a question a human asked, and a human decided whether to keep the answer. Which means these maps carry what human work carries: opinions, gaps, and the occasional plain mistake. Take them as such — and when you find one, you’re one click from fixing it.
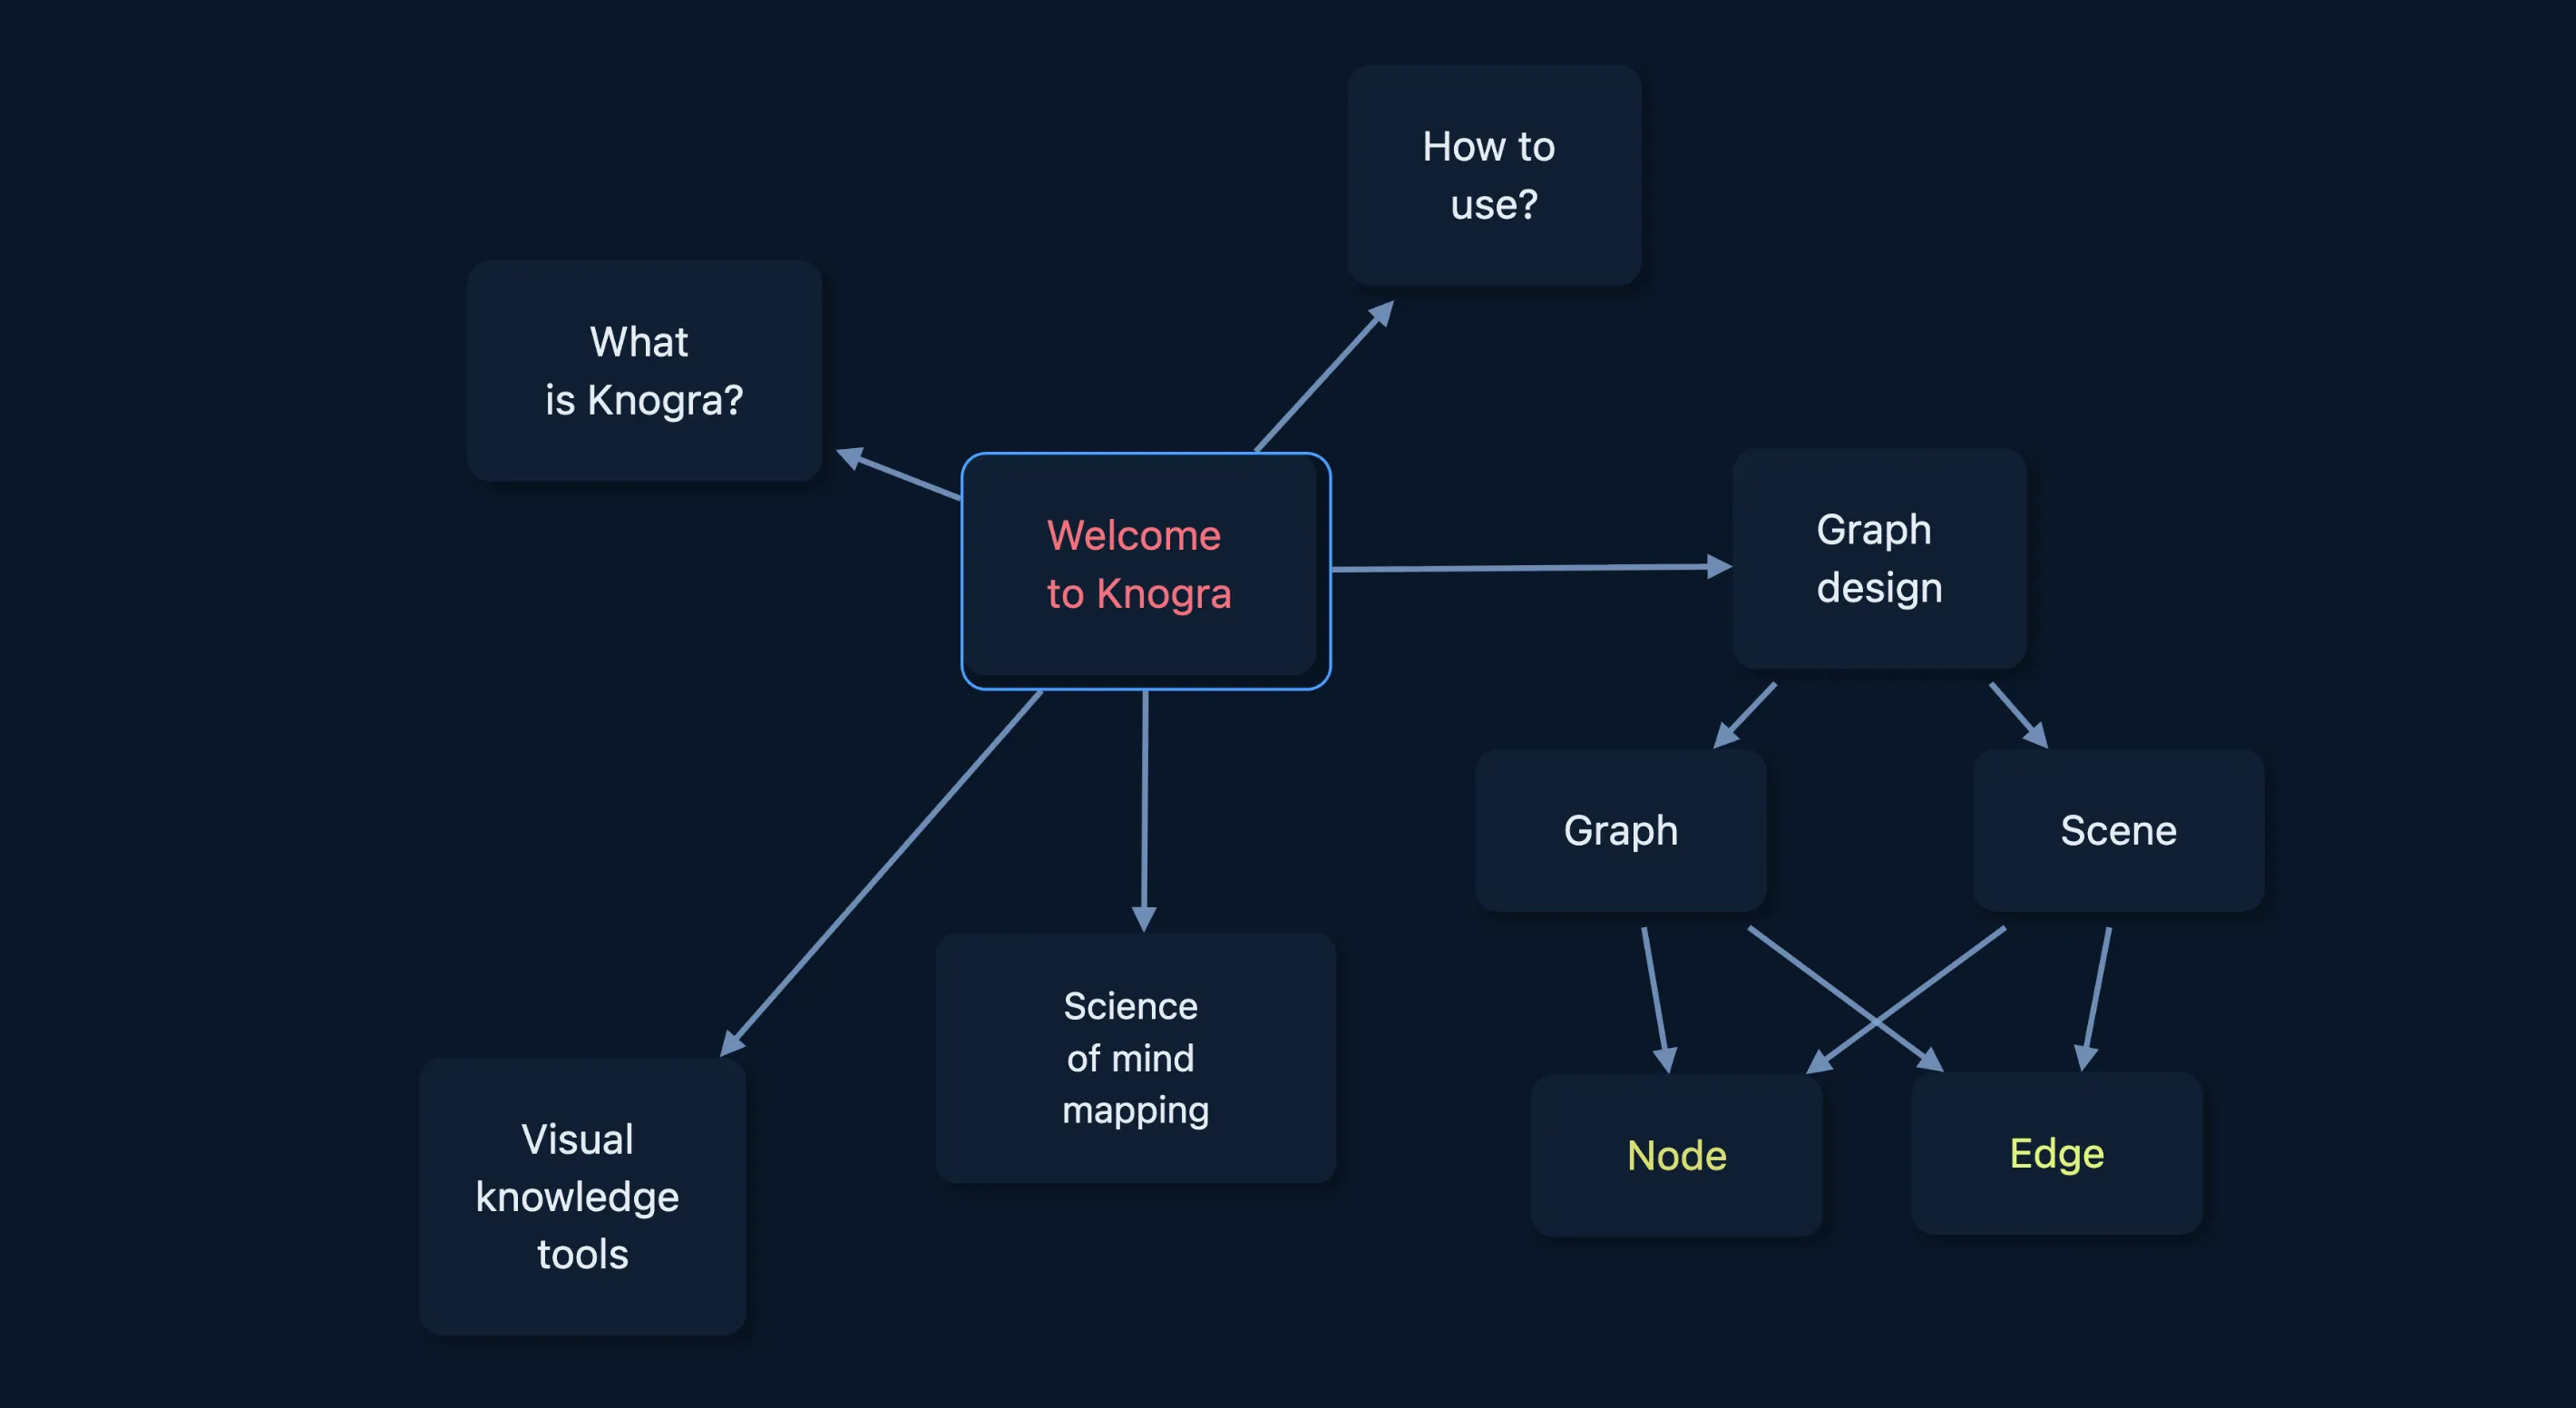
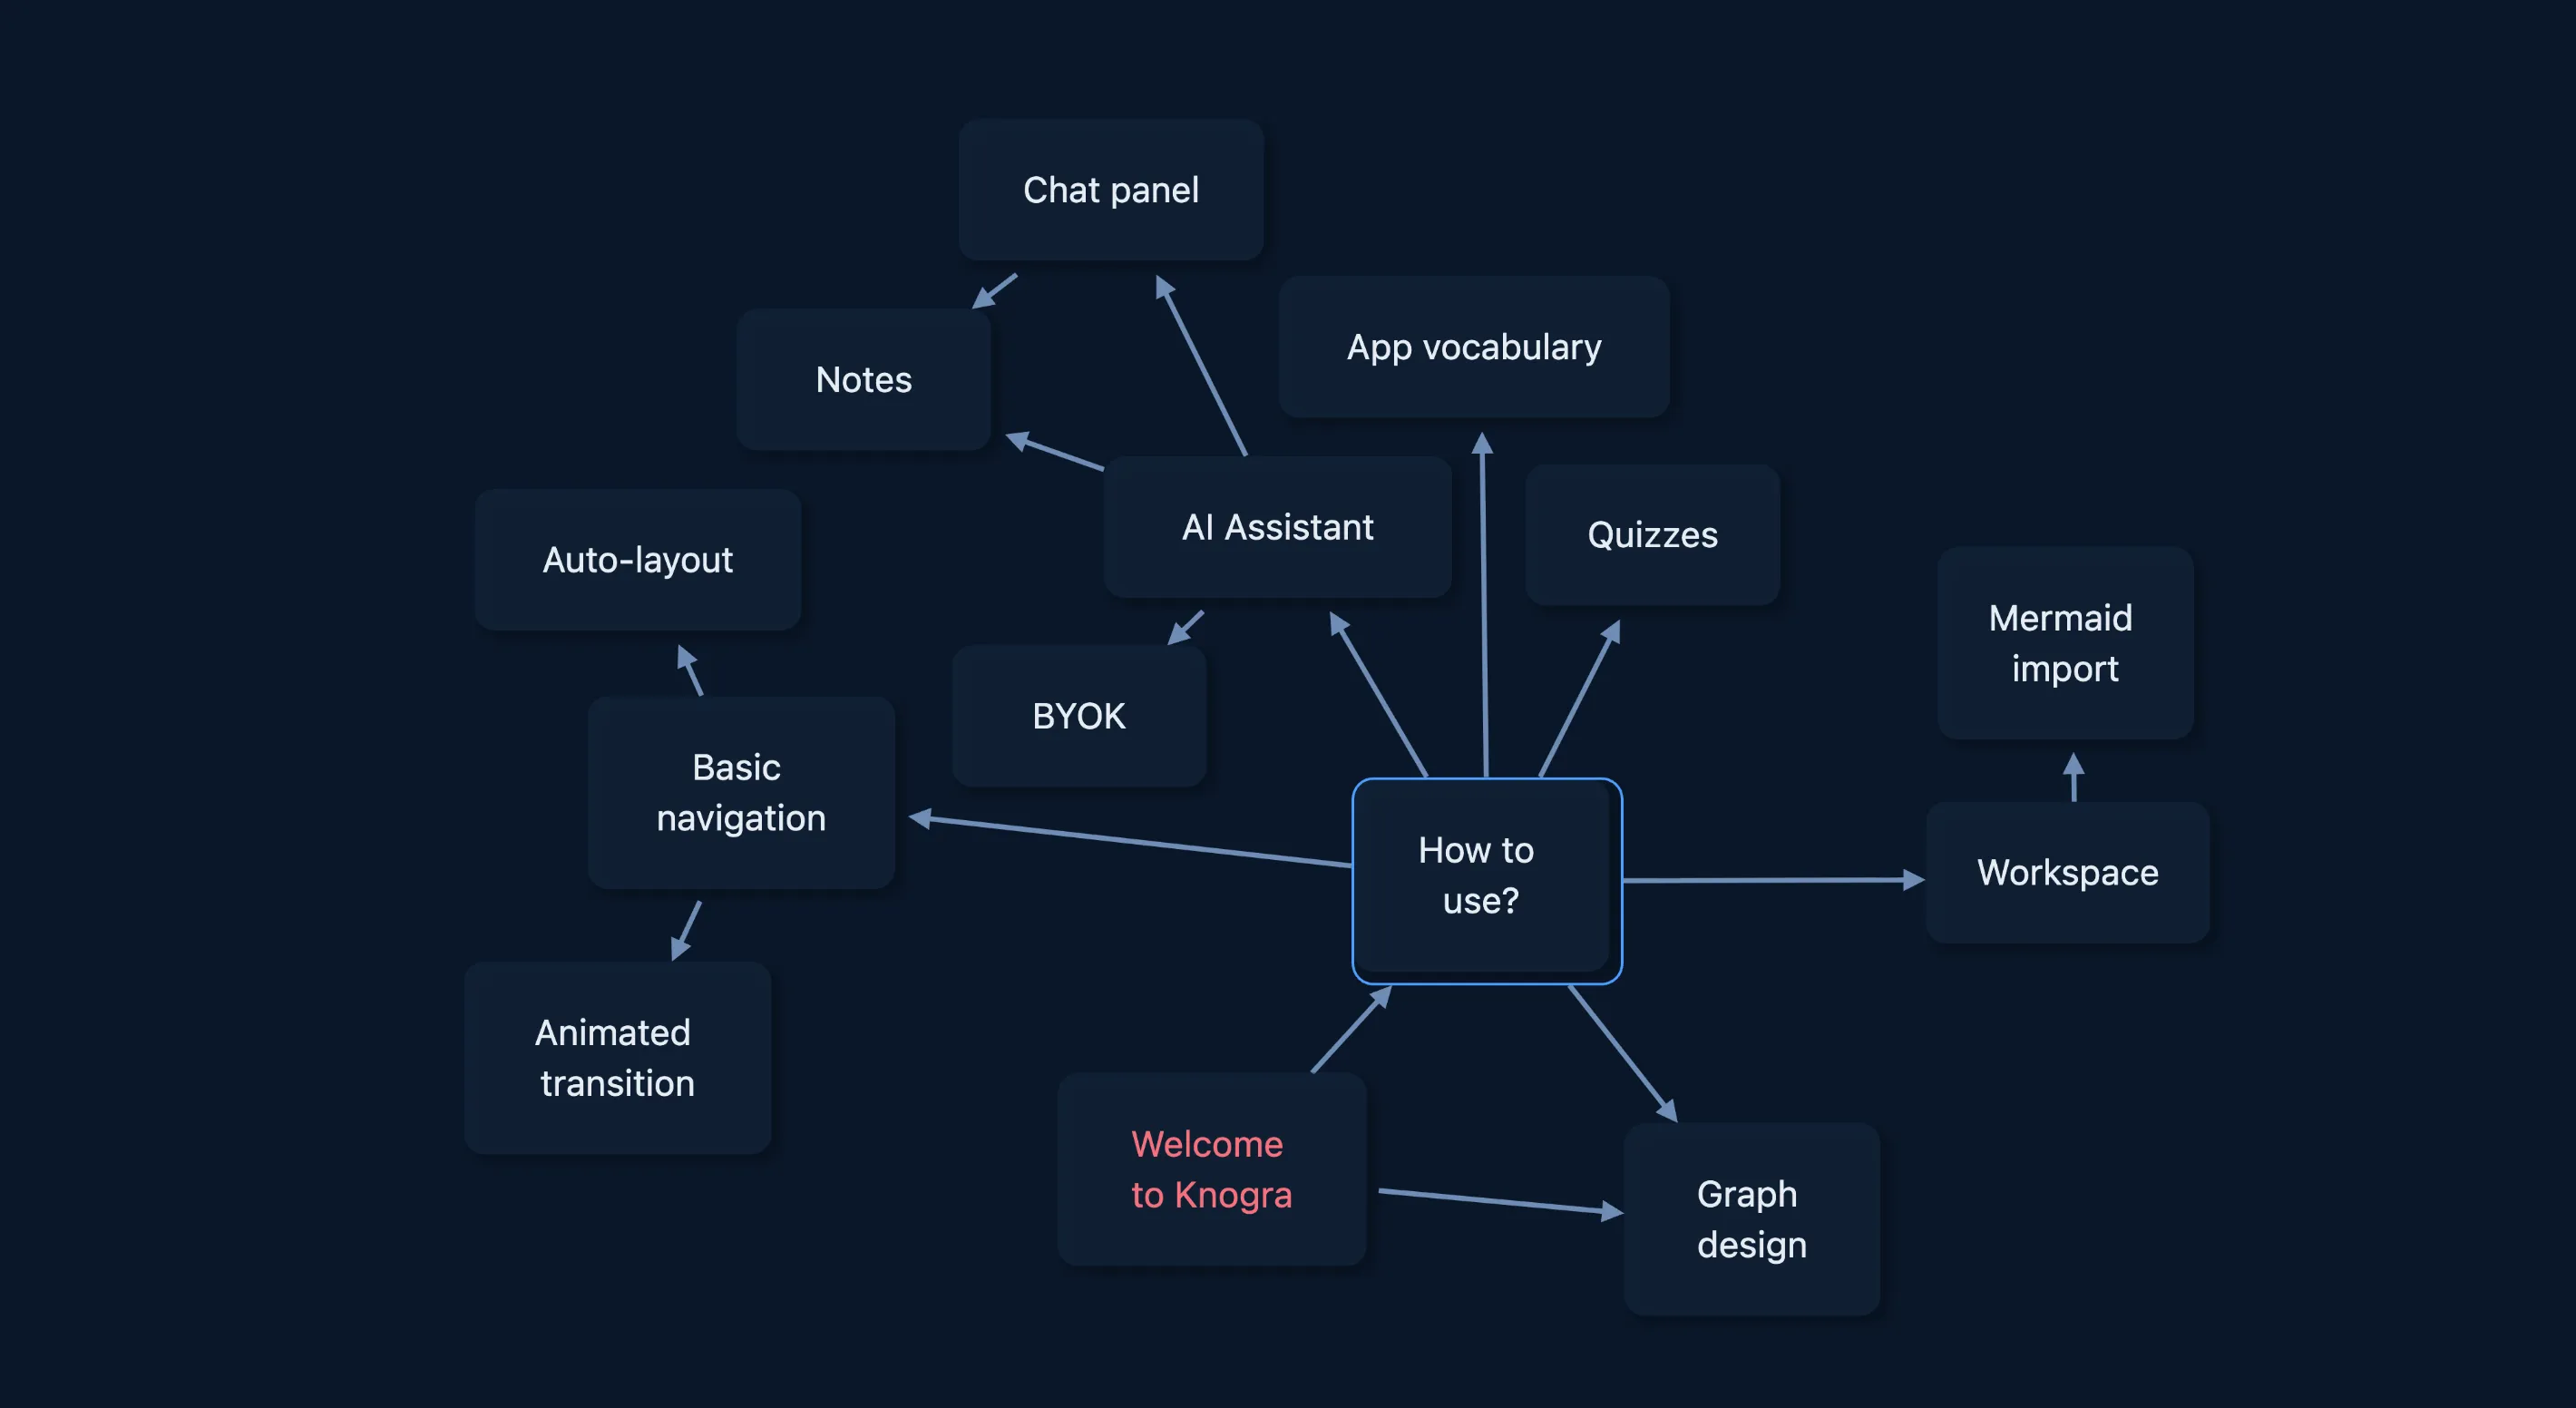
Start here to learn how Knogra works and why it exists. Build and navigate your first graph, discover what it's for and where it helps, and see how a spatial, scene-based map compares to outlines, mind maps, and ordinary diagrams. The fastest way to get productive.
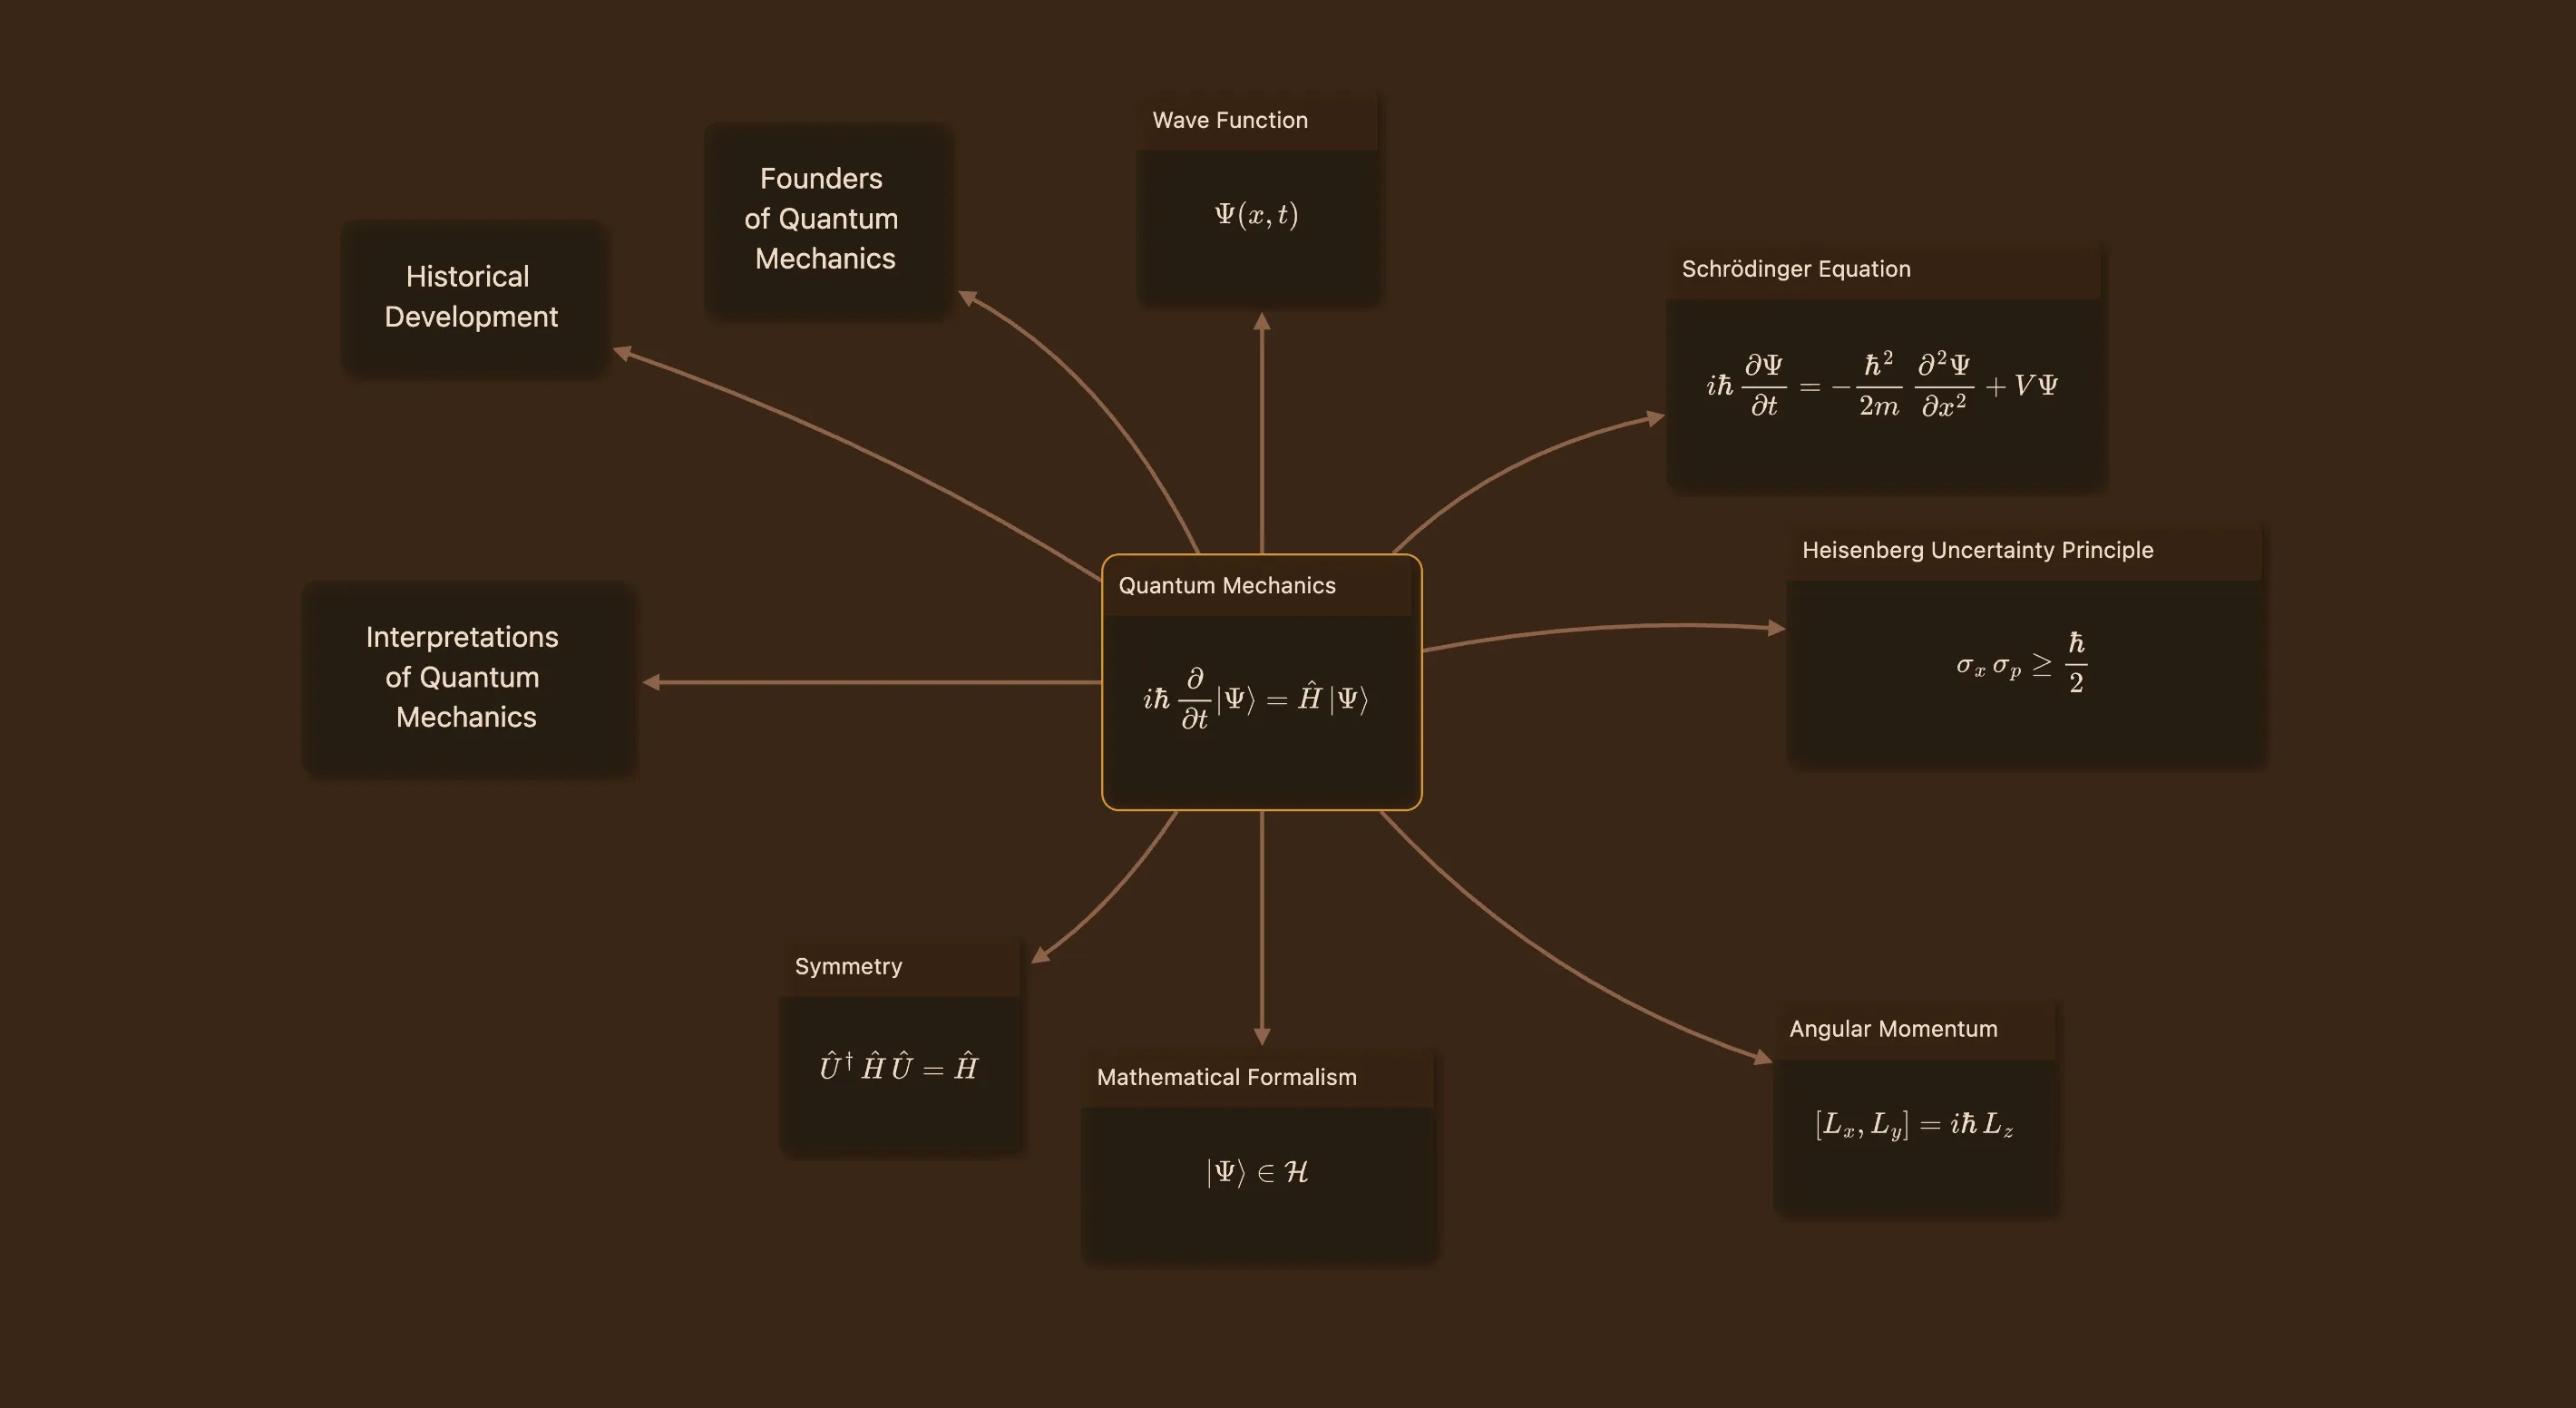
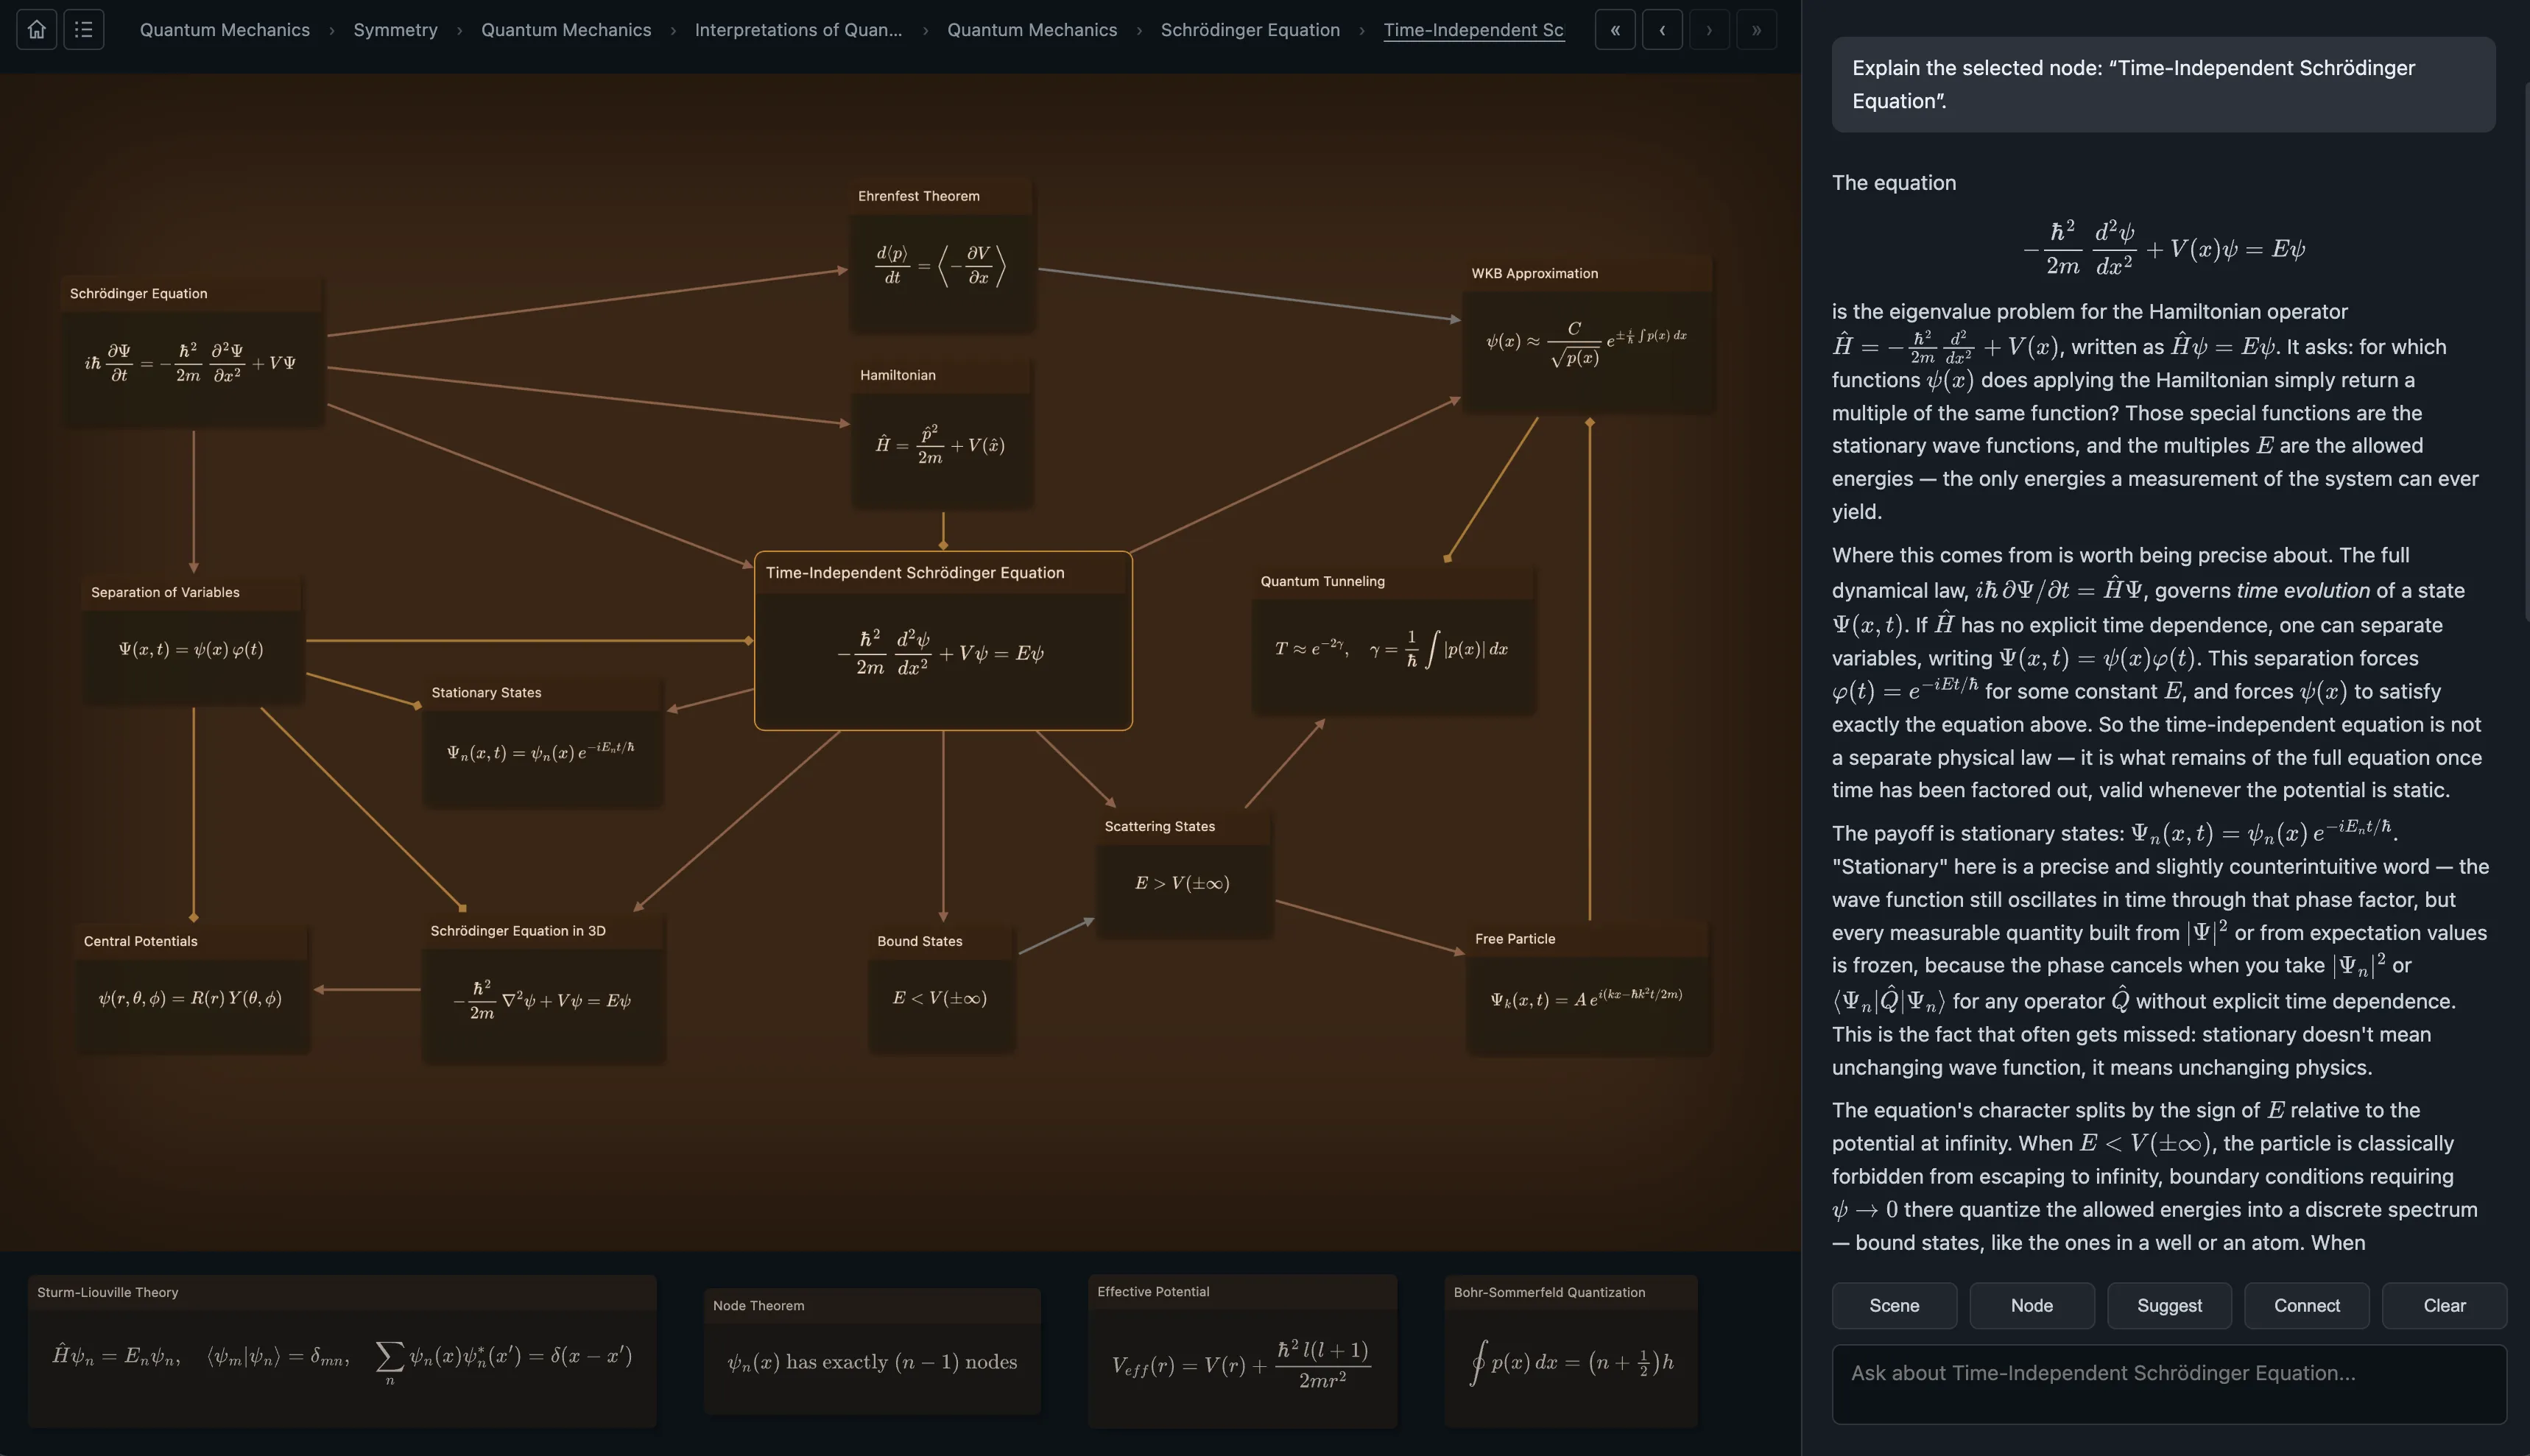
An undergraduate introduction to quantum mechanics, built as a connected map rather than a linear text. Walk from the Schrödinger equation through wave functions, superposition, operators and observables, the uncertainty principle, and spin — each node carrying its own equation, worked scene by scene so the structure stays visible.
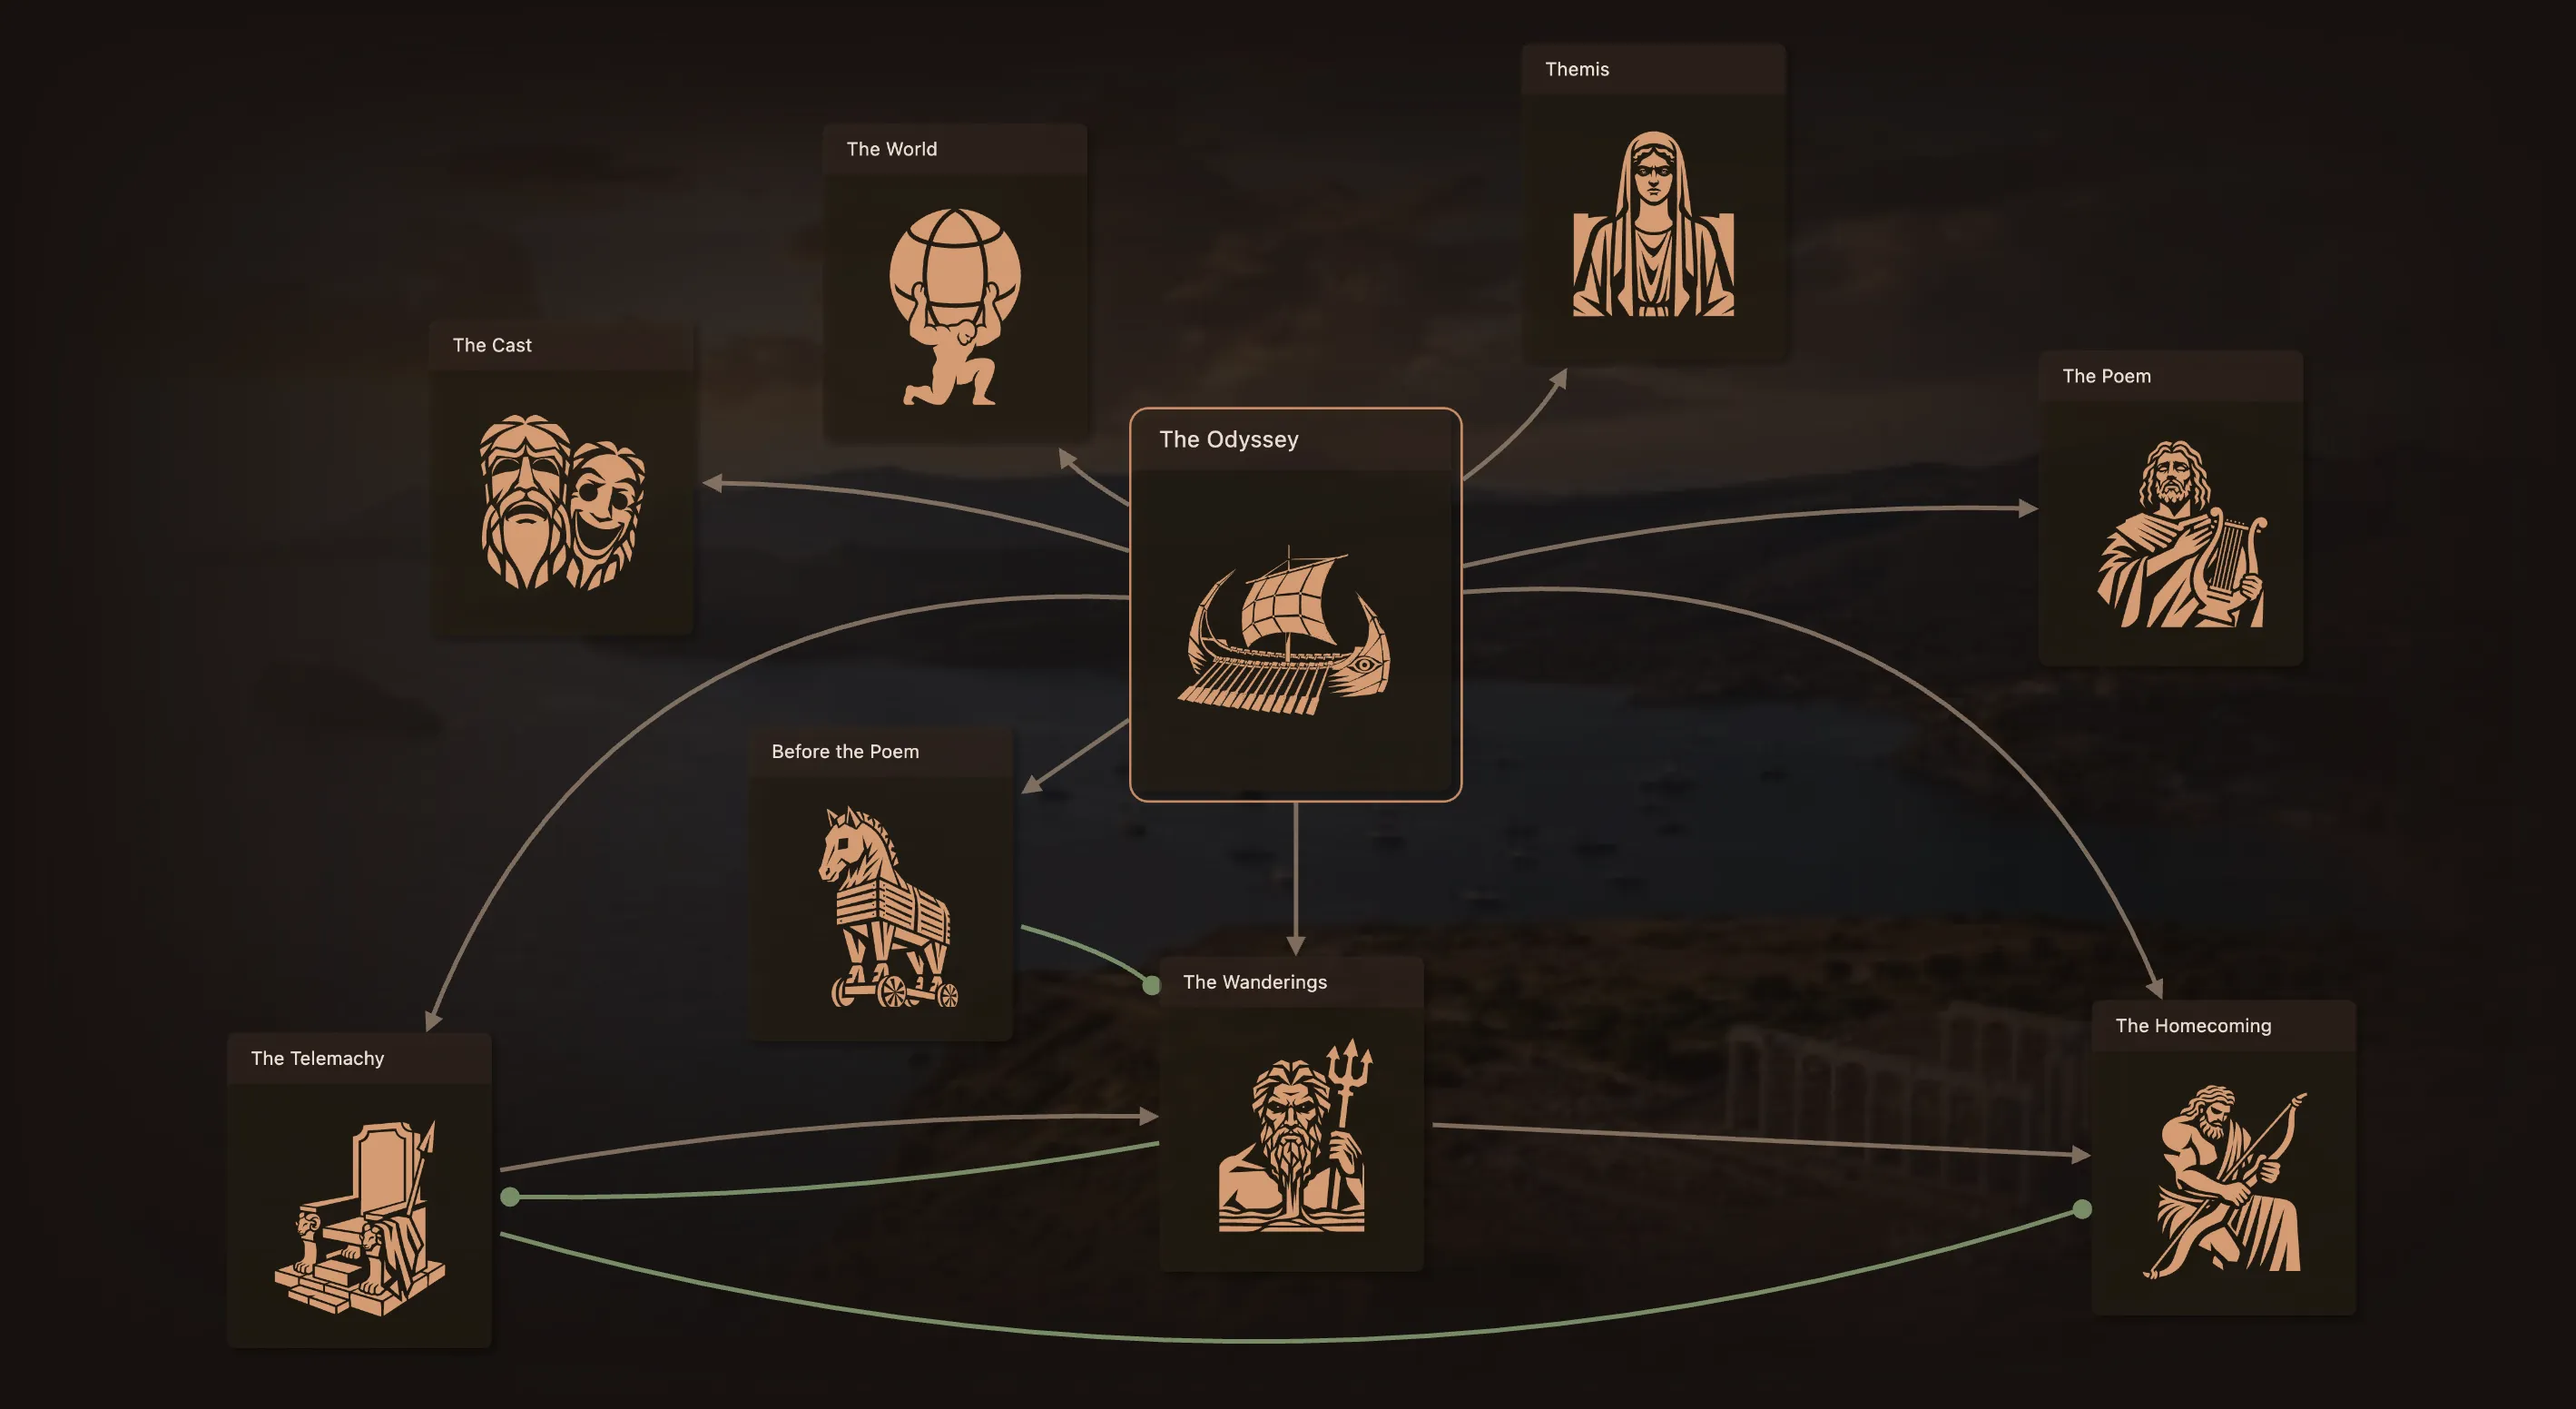
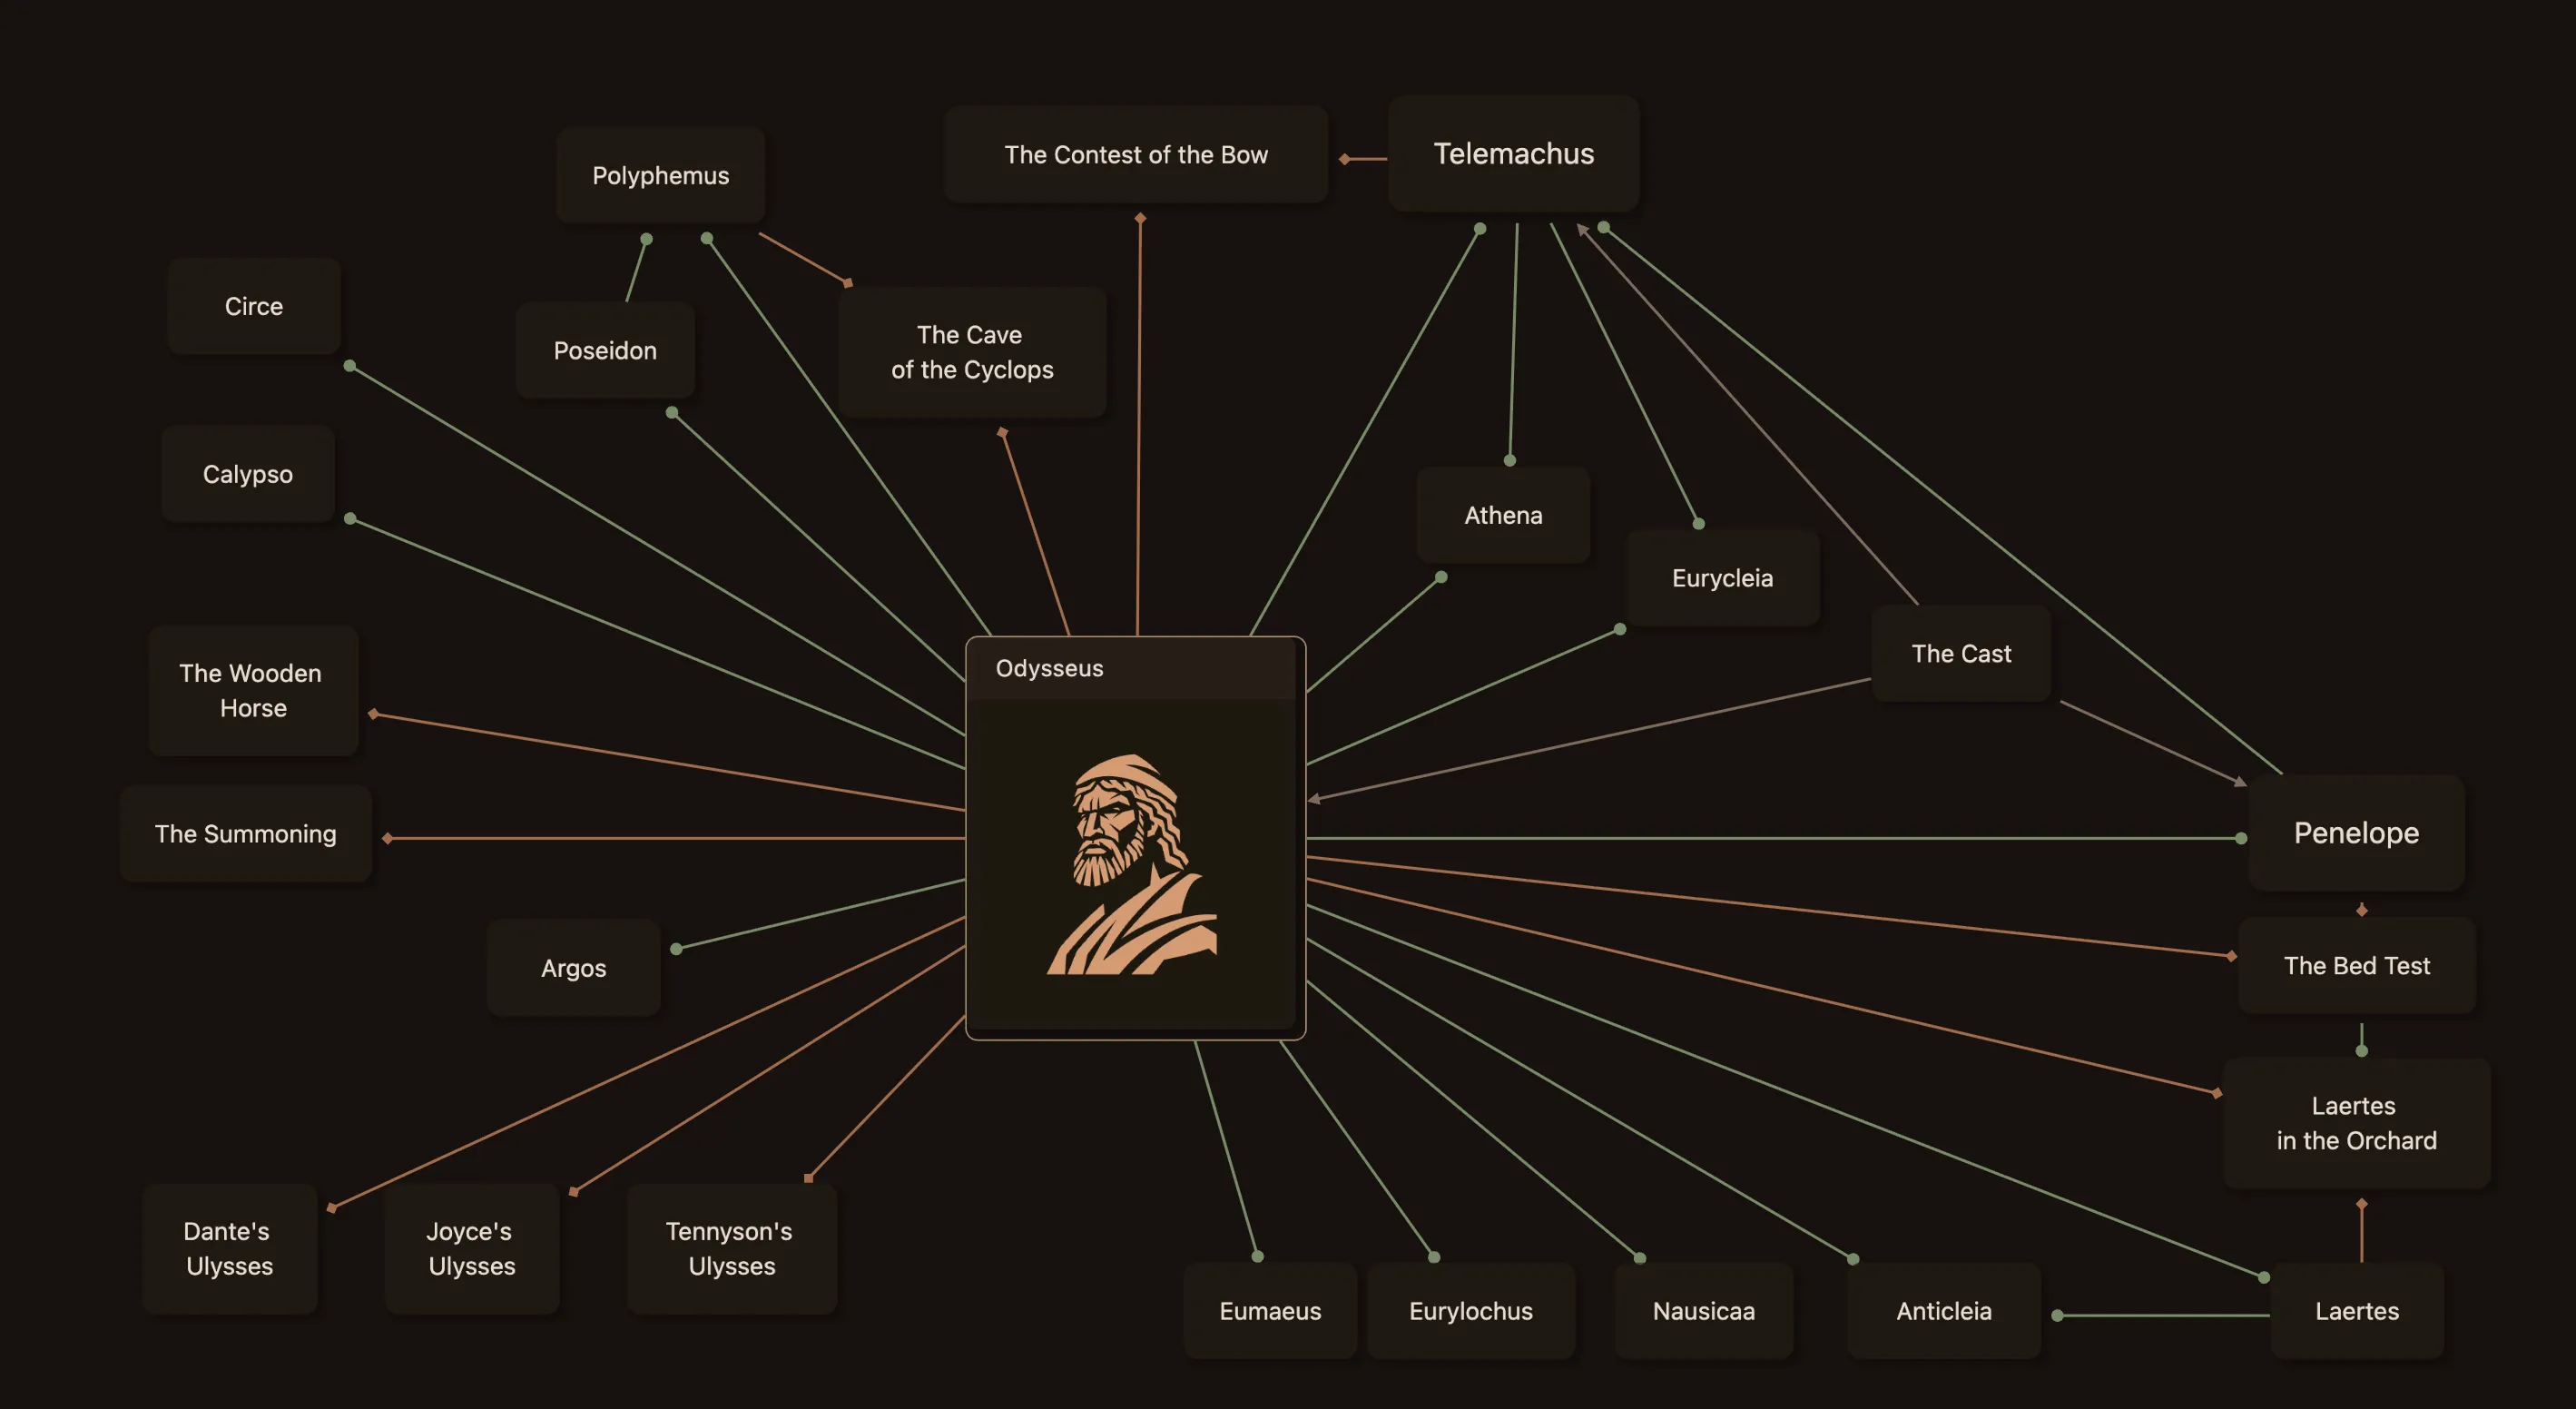
Homer's epic as a map rather than a line — the Telemachy, the wanderings, and the homecoming, with the household waiting on Ithaca, the gods arguing above it, and the moral order the whole poem turns on. Walk the story in the order it happens, or in the order Homer tells it, and see why the two are not the same.
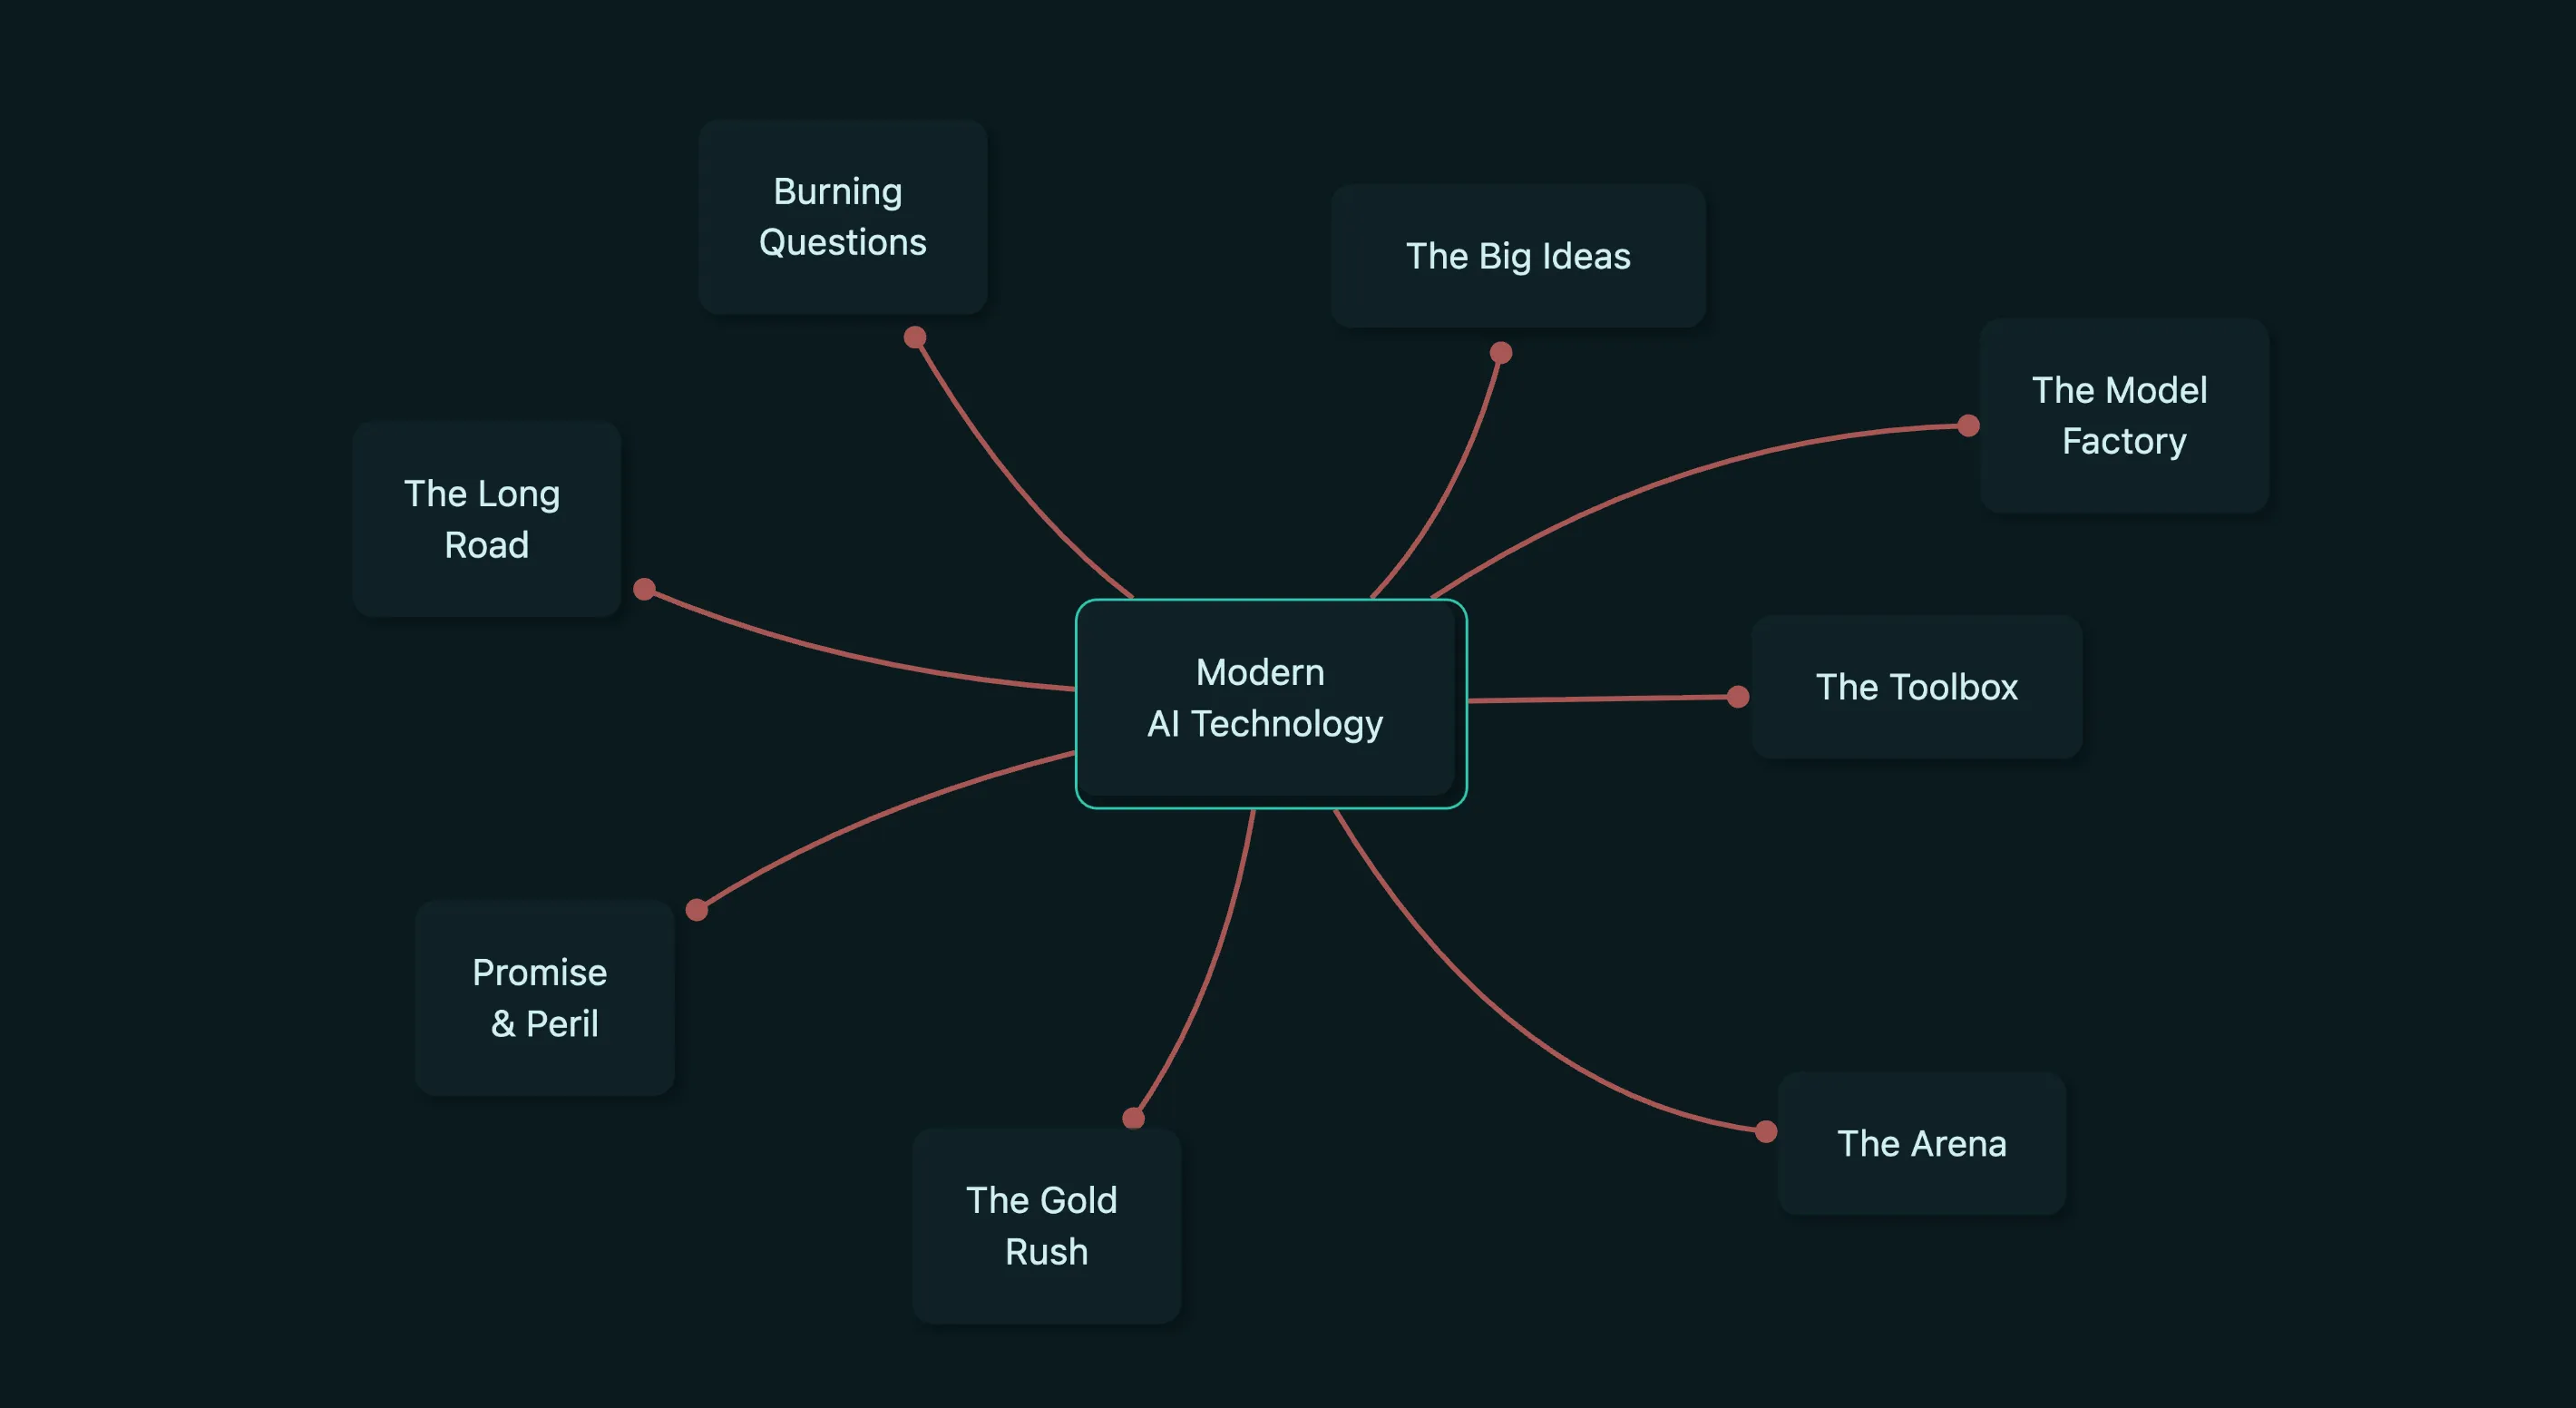
A wide-angle map of AI, past and present — the architectures and breakthroughs, the companies and the people, and the economic and cultural forces shaping the field. Not a lecture but a working mental model and brainstorming record: explore artificial intelligence from every angle, scene by scene.
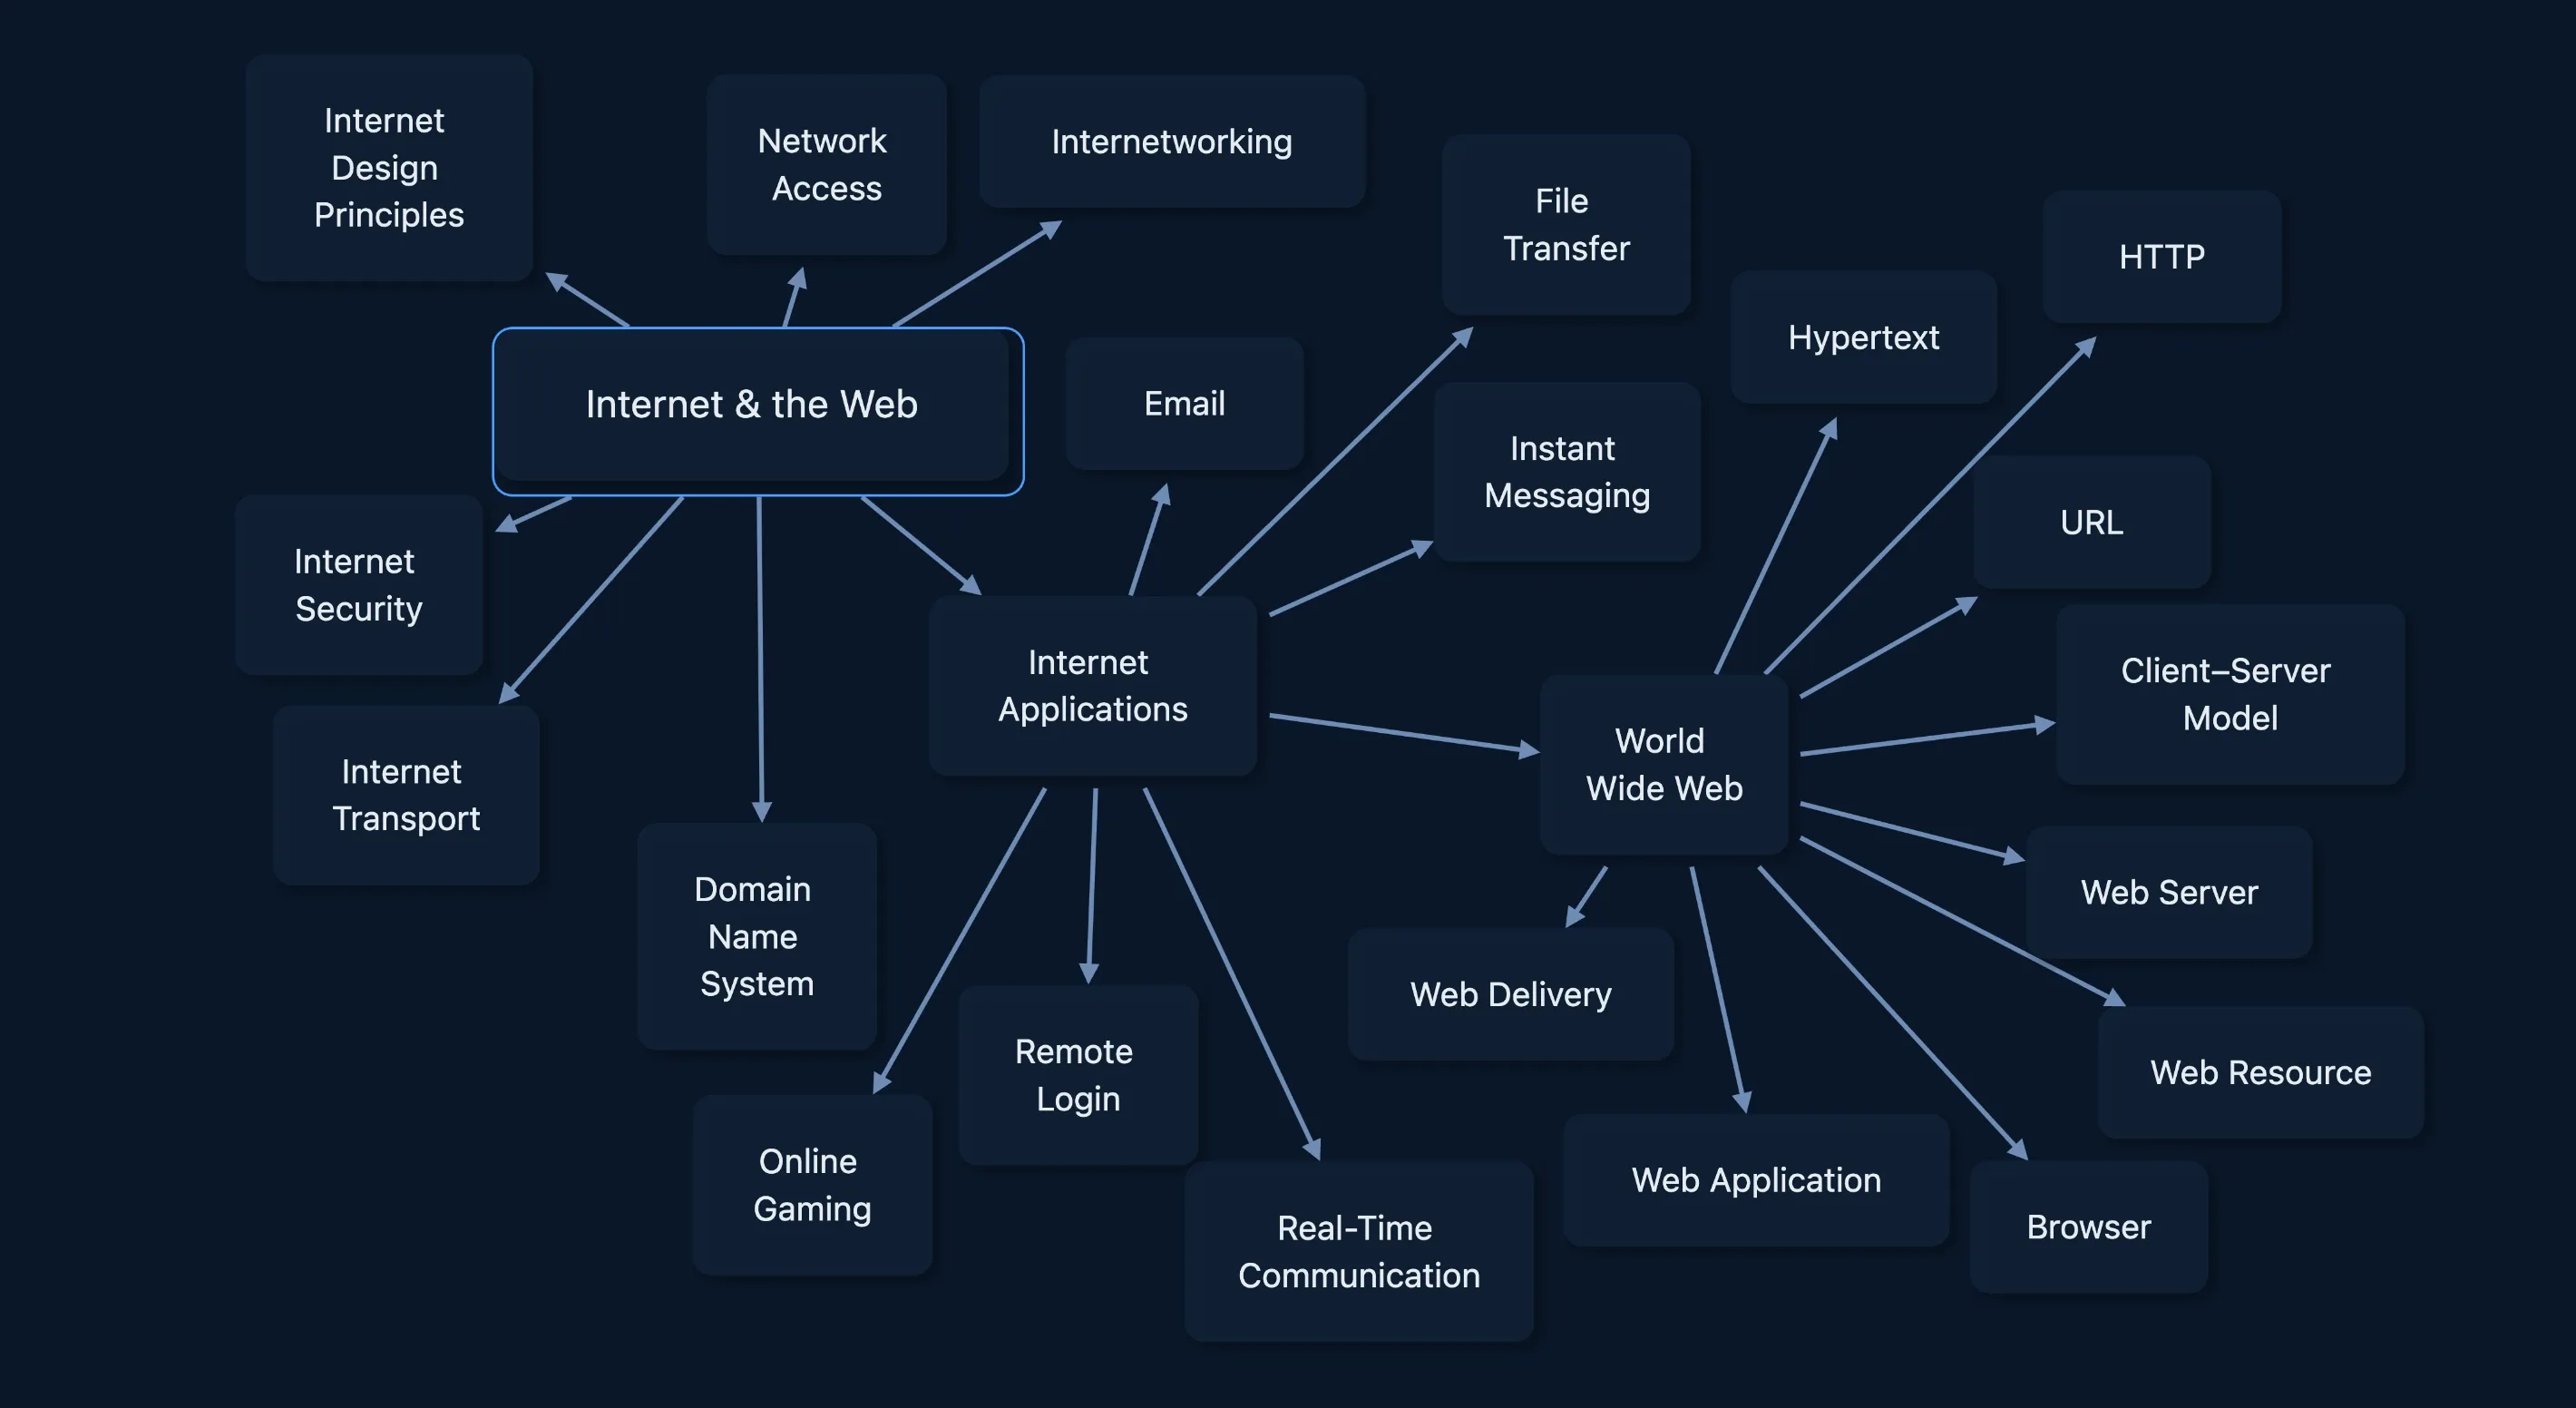
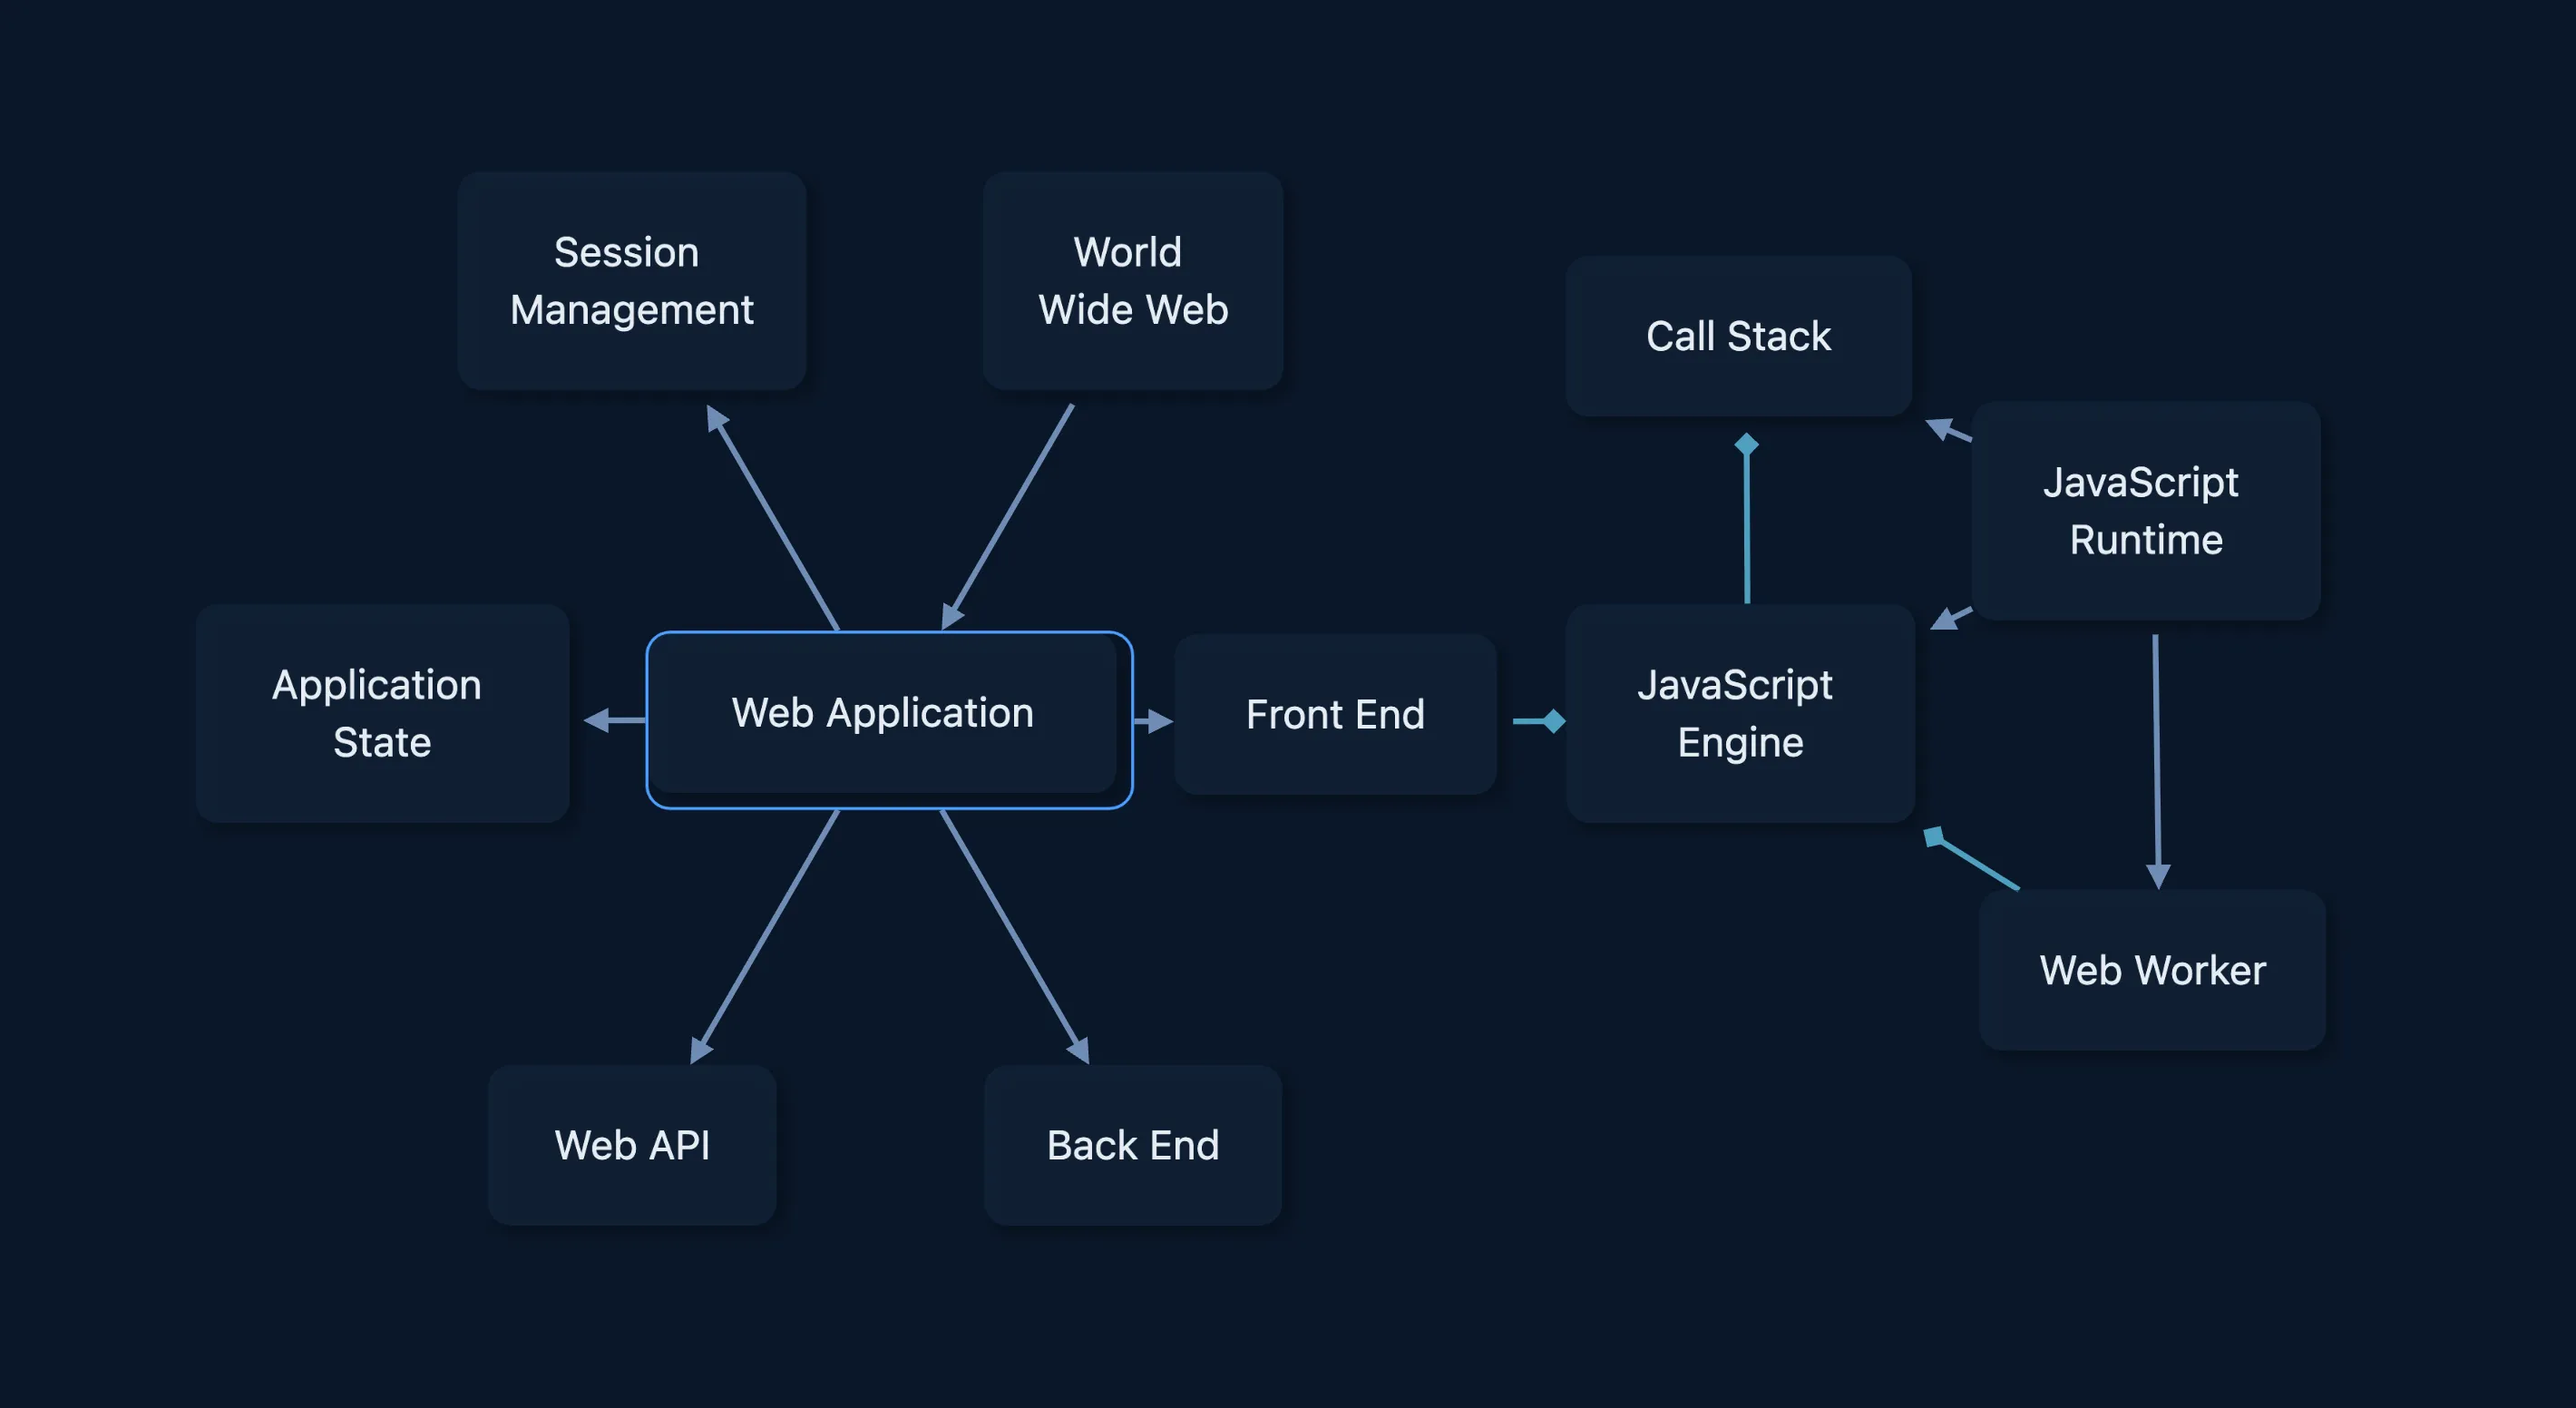
A visual guide to how the Internet and the Web actually work — networking fundamentals, routing, DNS, transport, security, browsers, HTTP, web servers, caching, CDNs, and modern infrastructure. Built to form a coherent mental model rather than isolated facts: ideal for self-study, onboarding, revision, or certification prep.
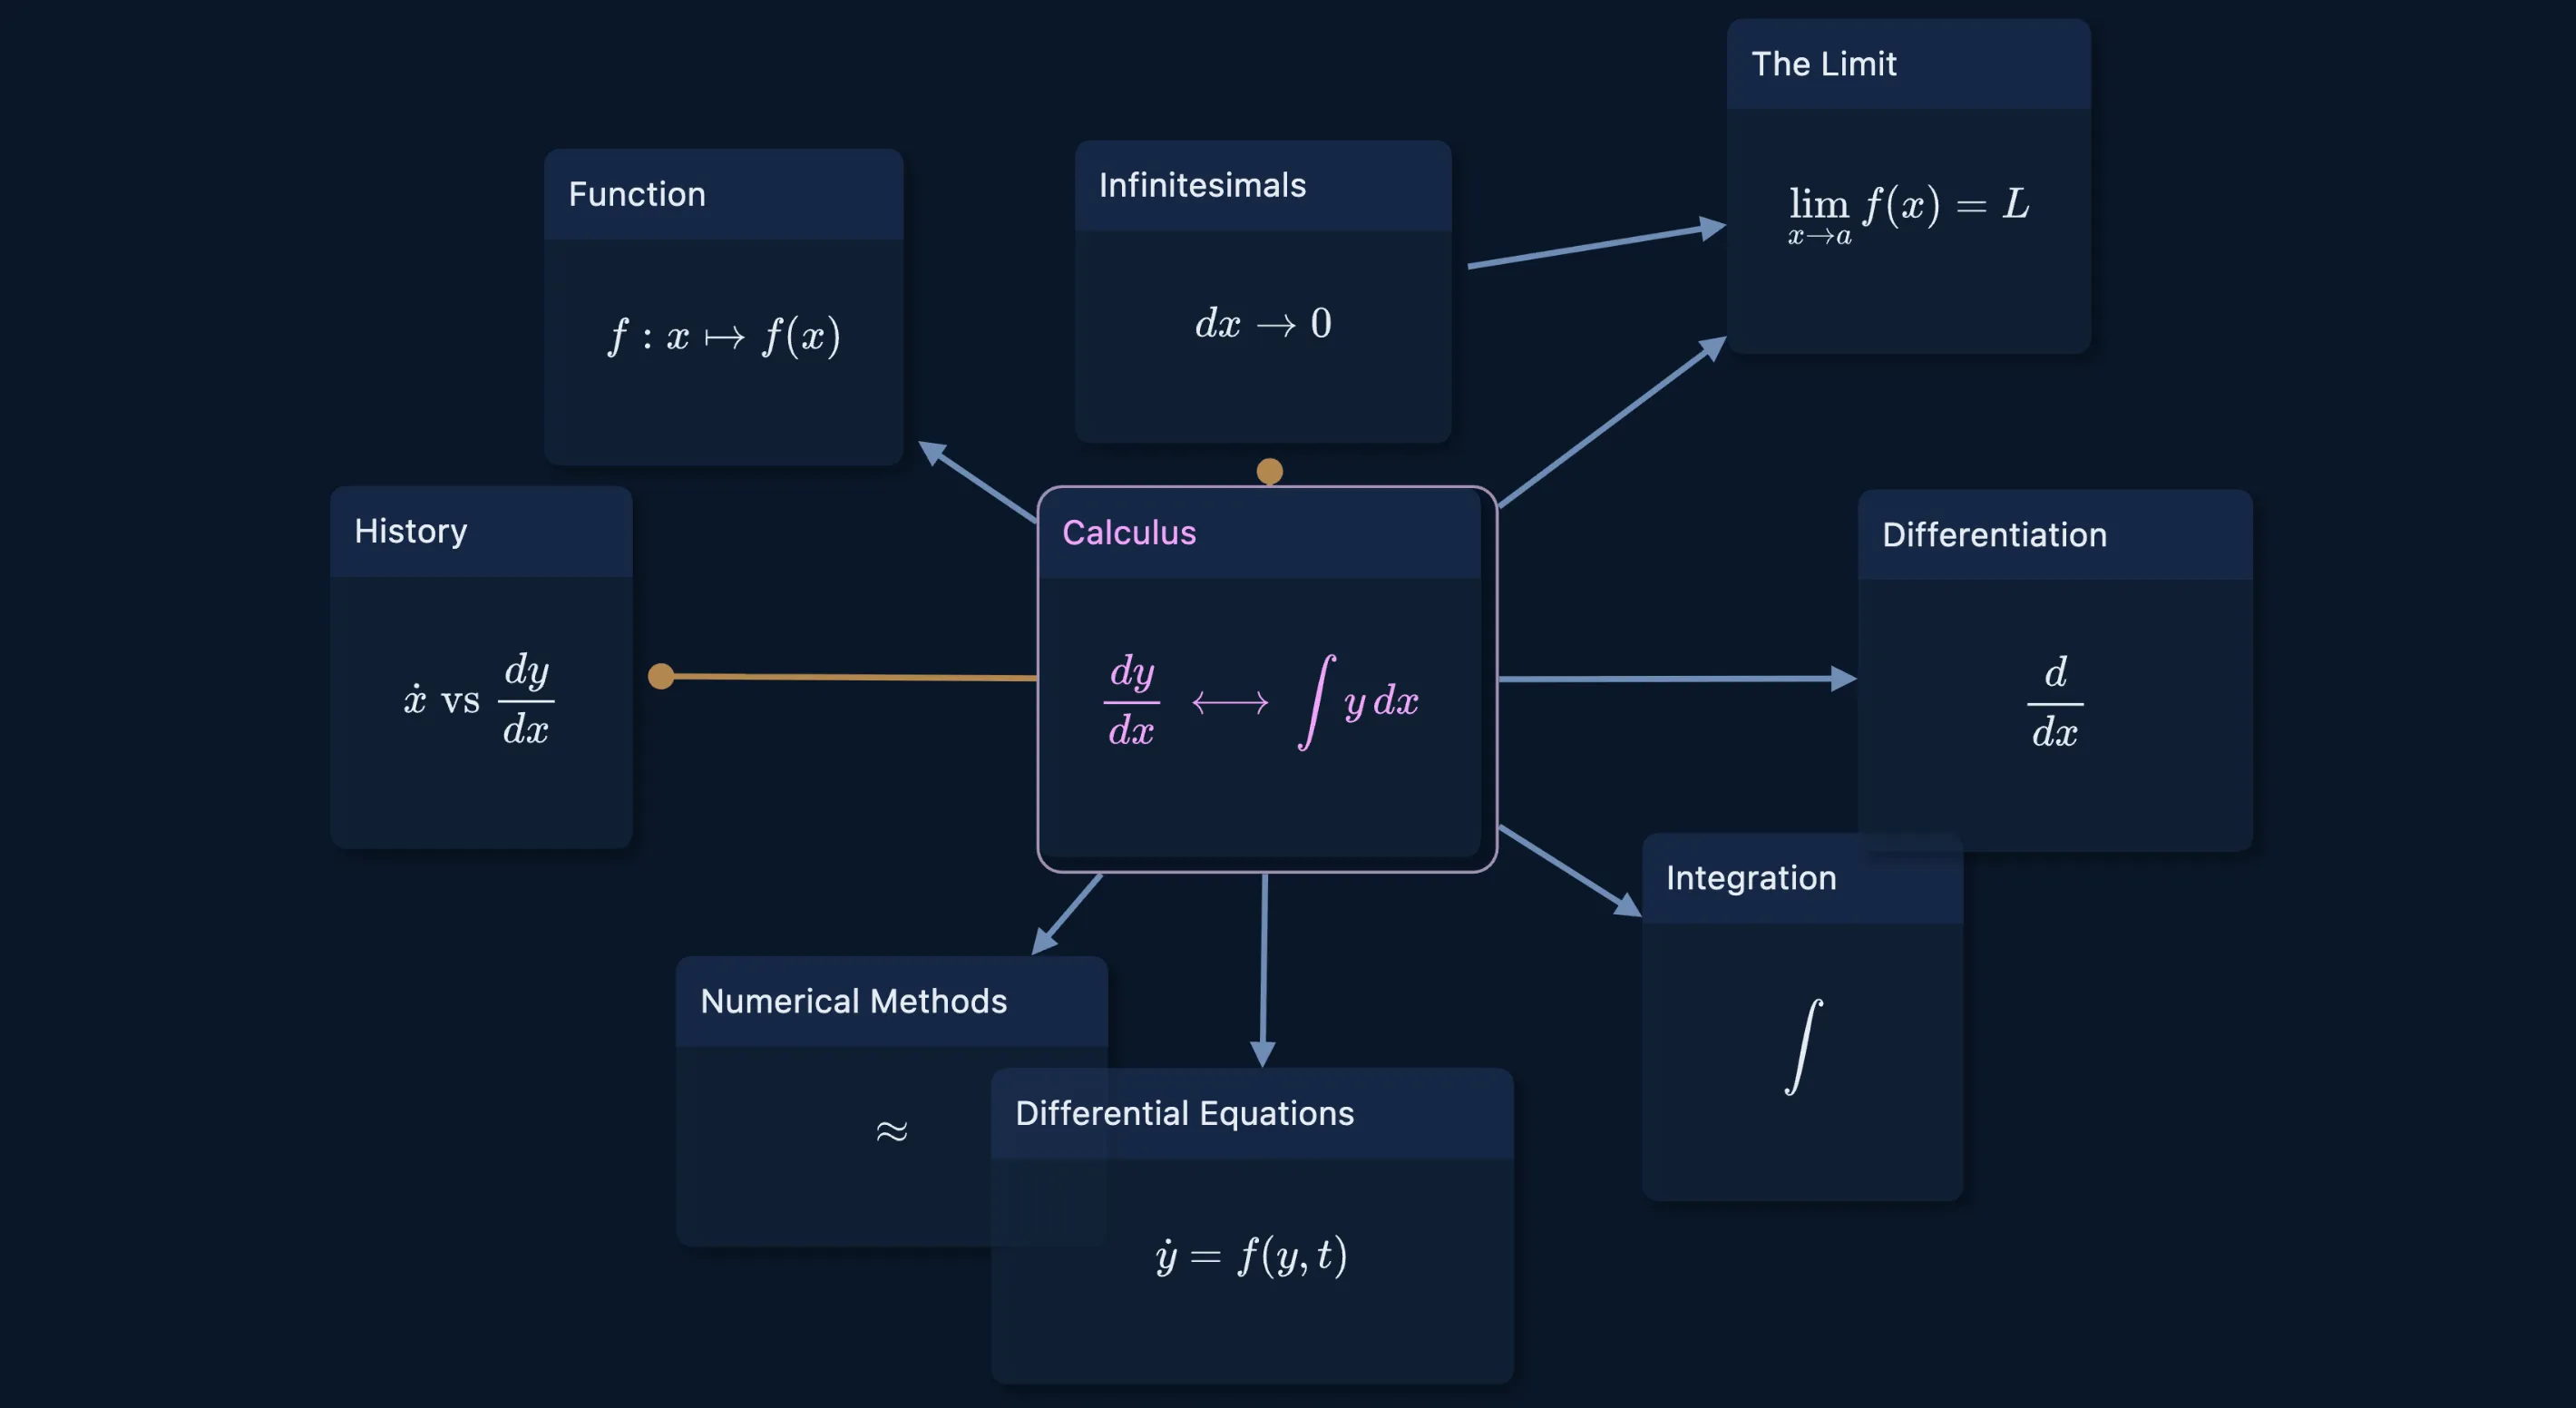
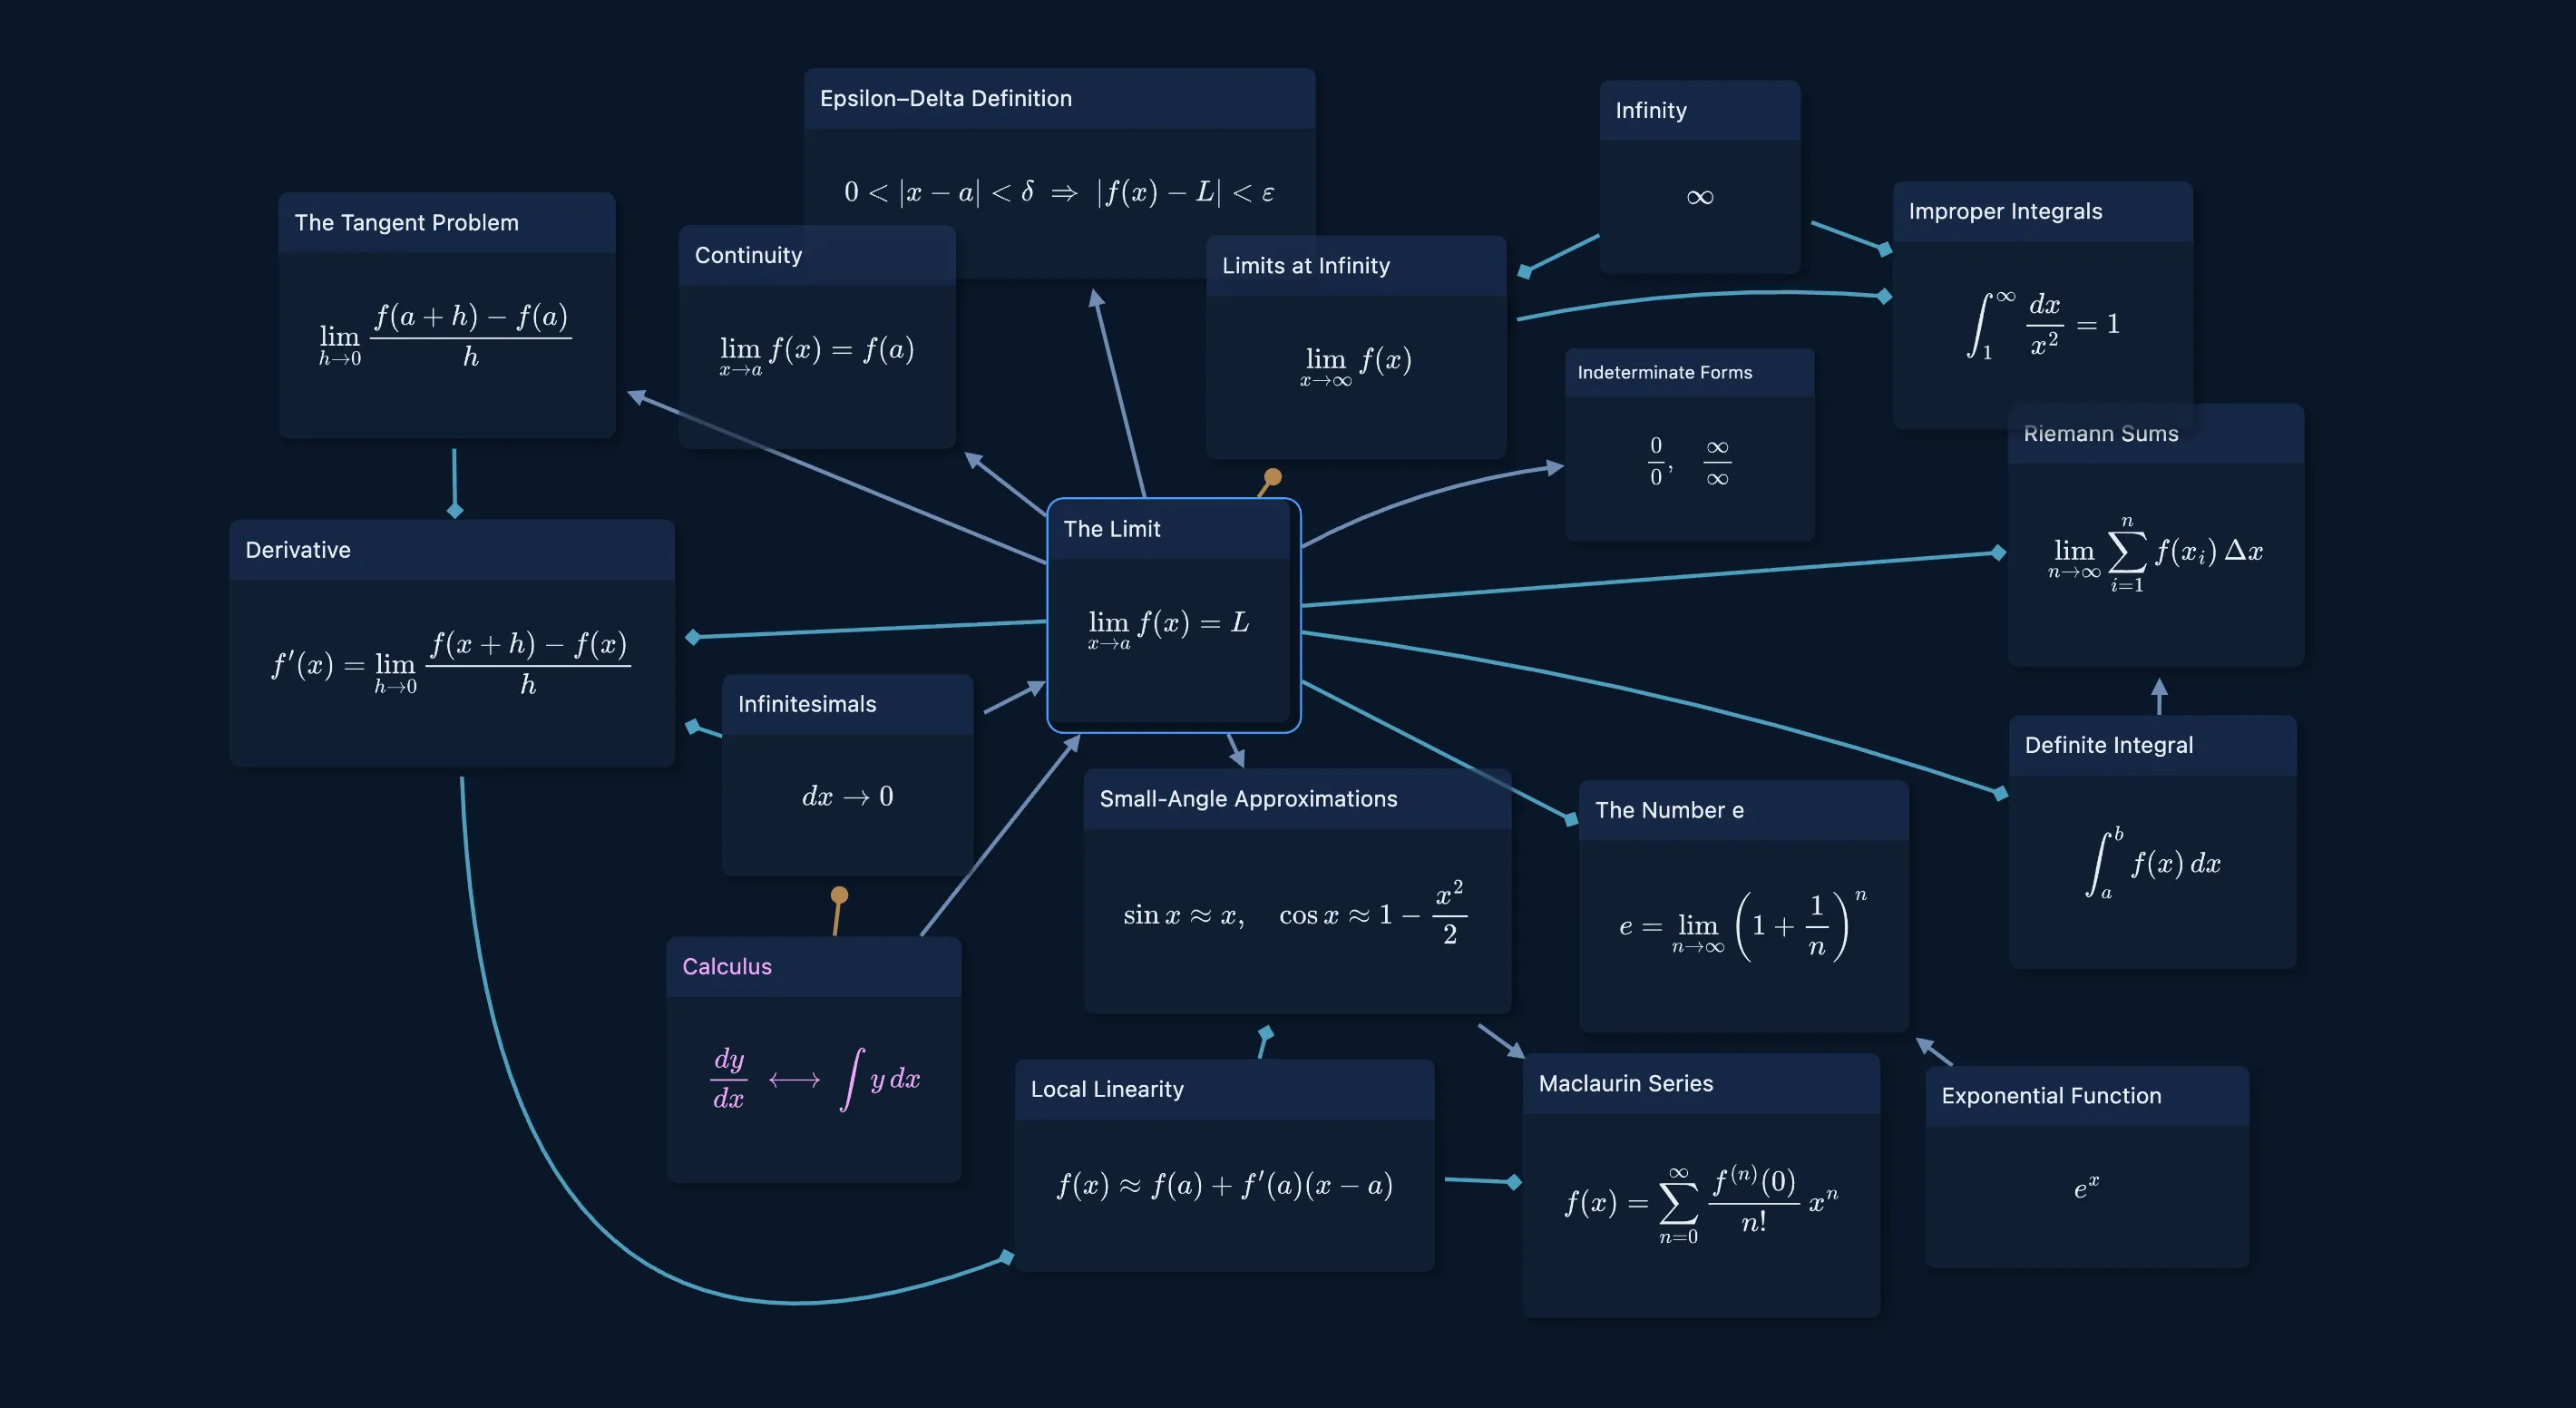
All of first-year calculus on one map — functions, limits, differentiation, integration, differential equations, and numerical methods, each node carrying its actual formula. A visual companion to your textbook: drill in scene by scene, following how each idea connects, instead of drowning in one flat diagram.
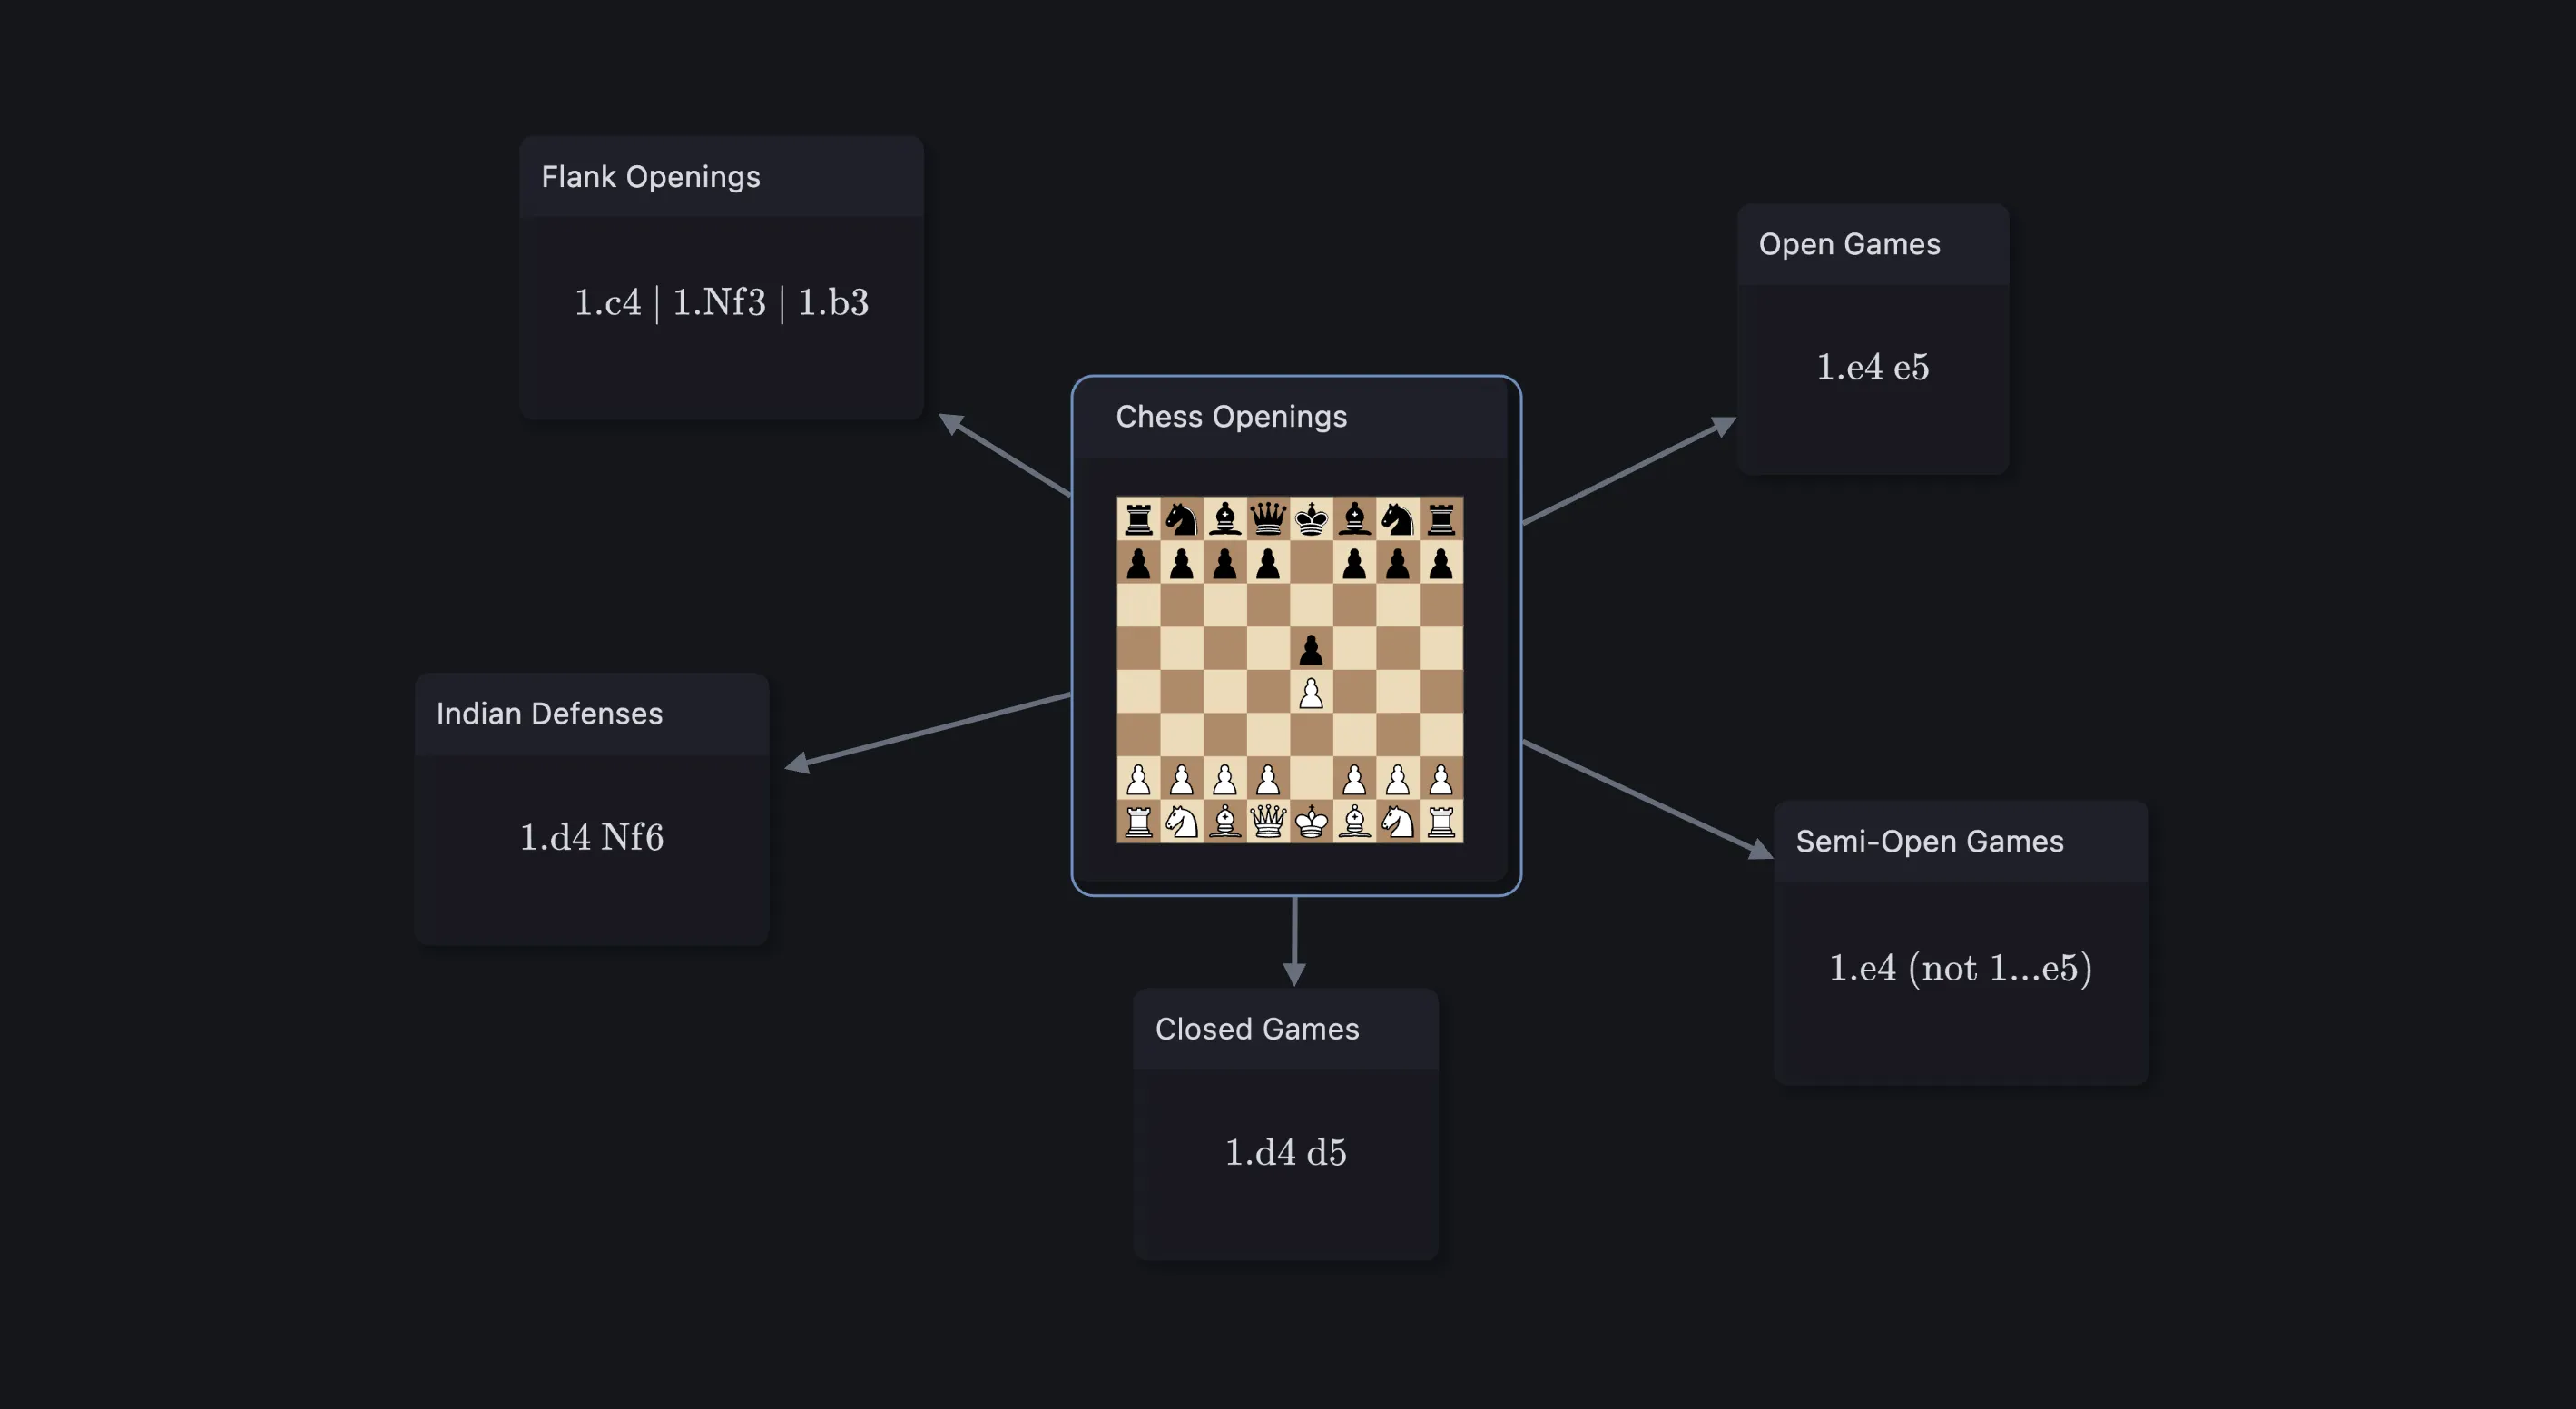
The opening tree, move by move — 1.e4 and 1.d4 down through the Sicilian, the Ruy Lopez, and the Queen's Gambit. Each line branches into the next move, the players who made it famous, and the games that defined it, all walked scene by scene instead of memorized from notation.
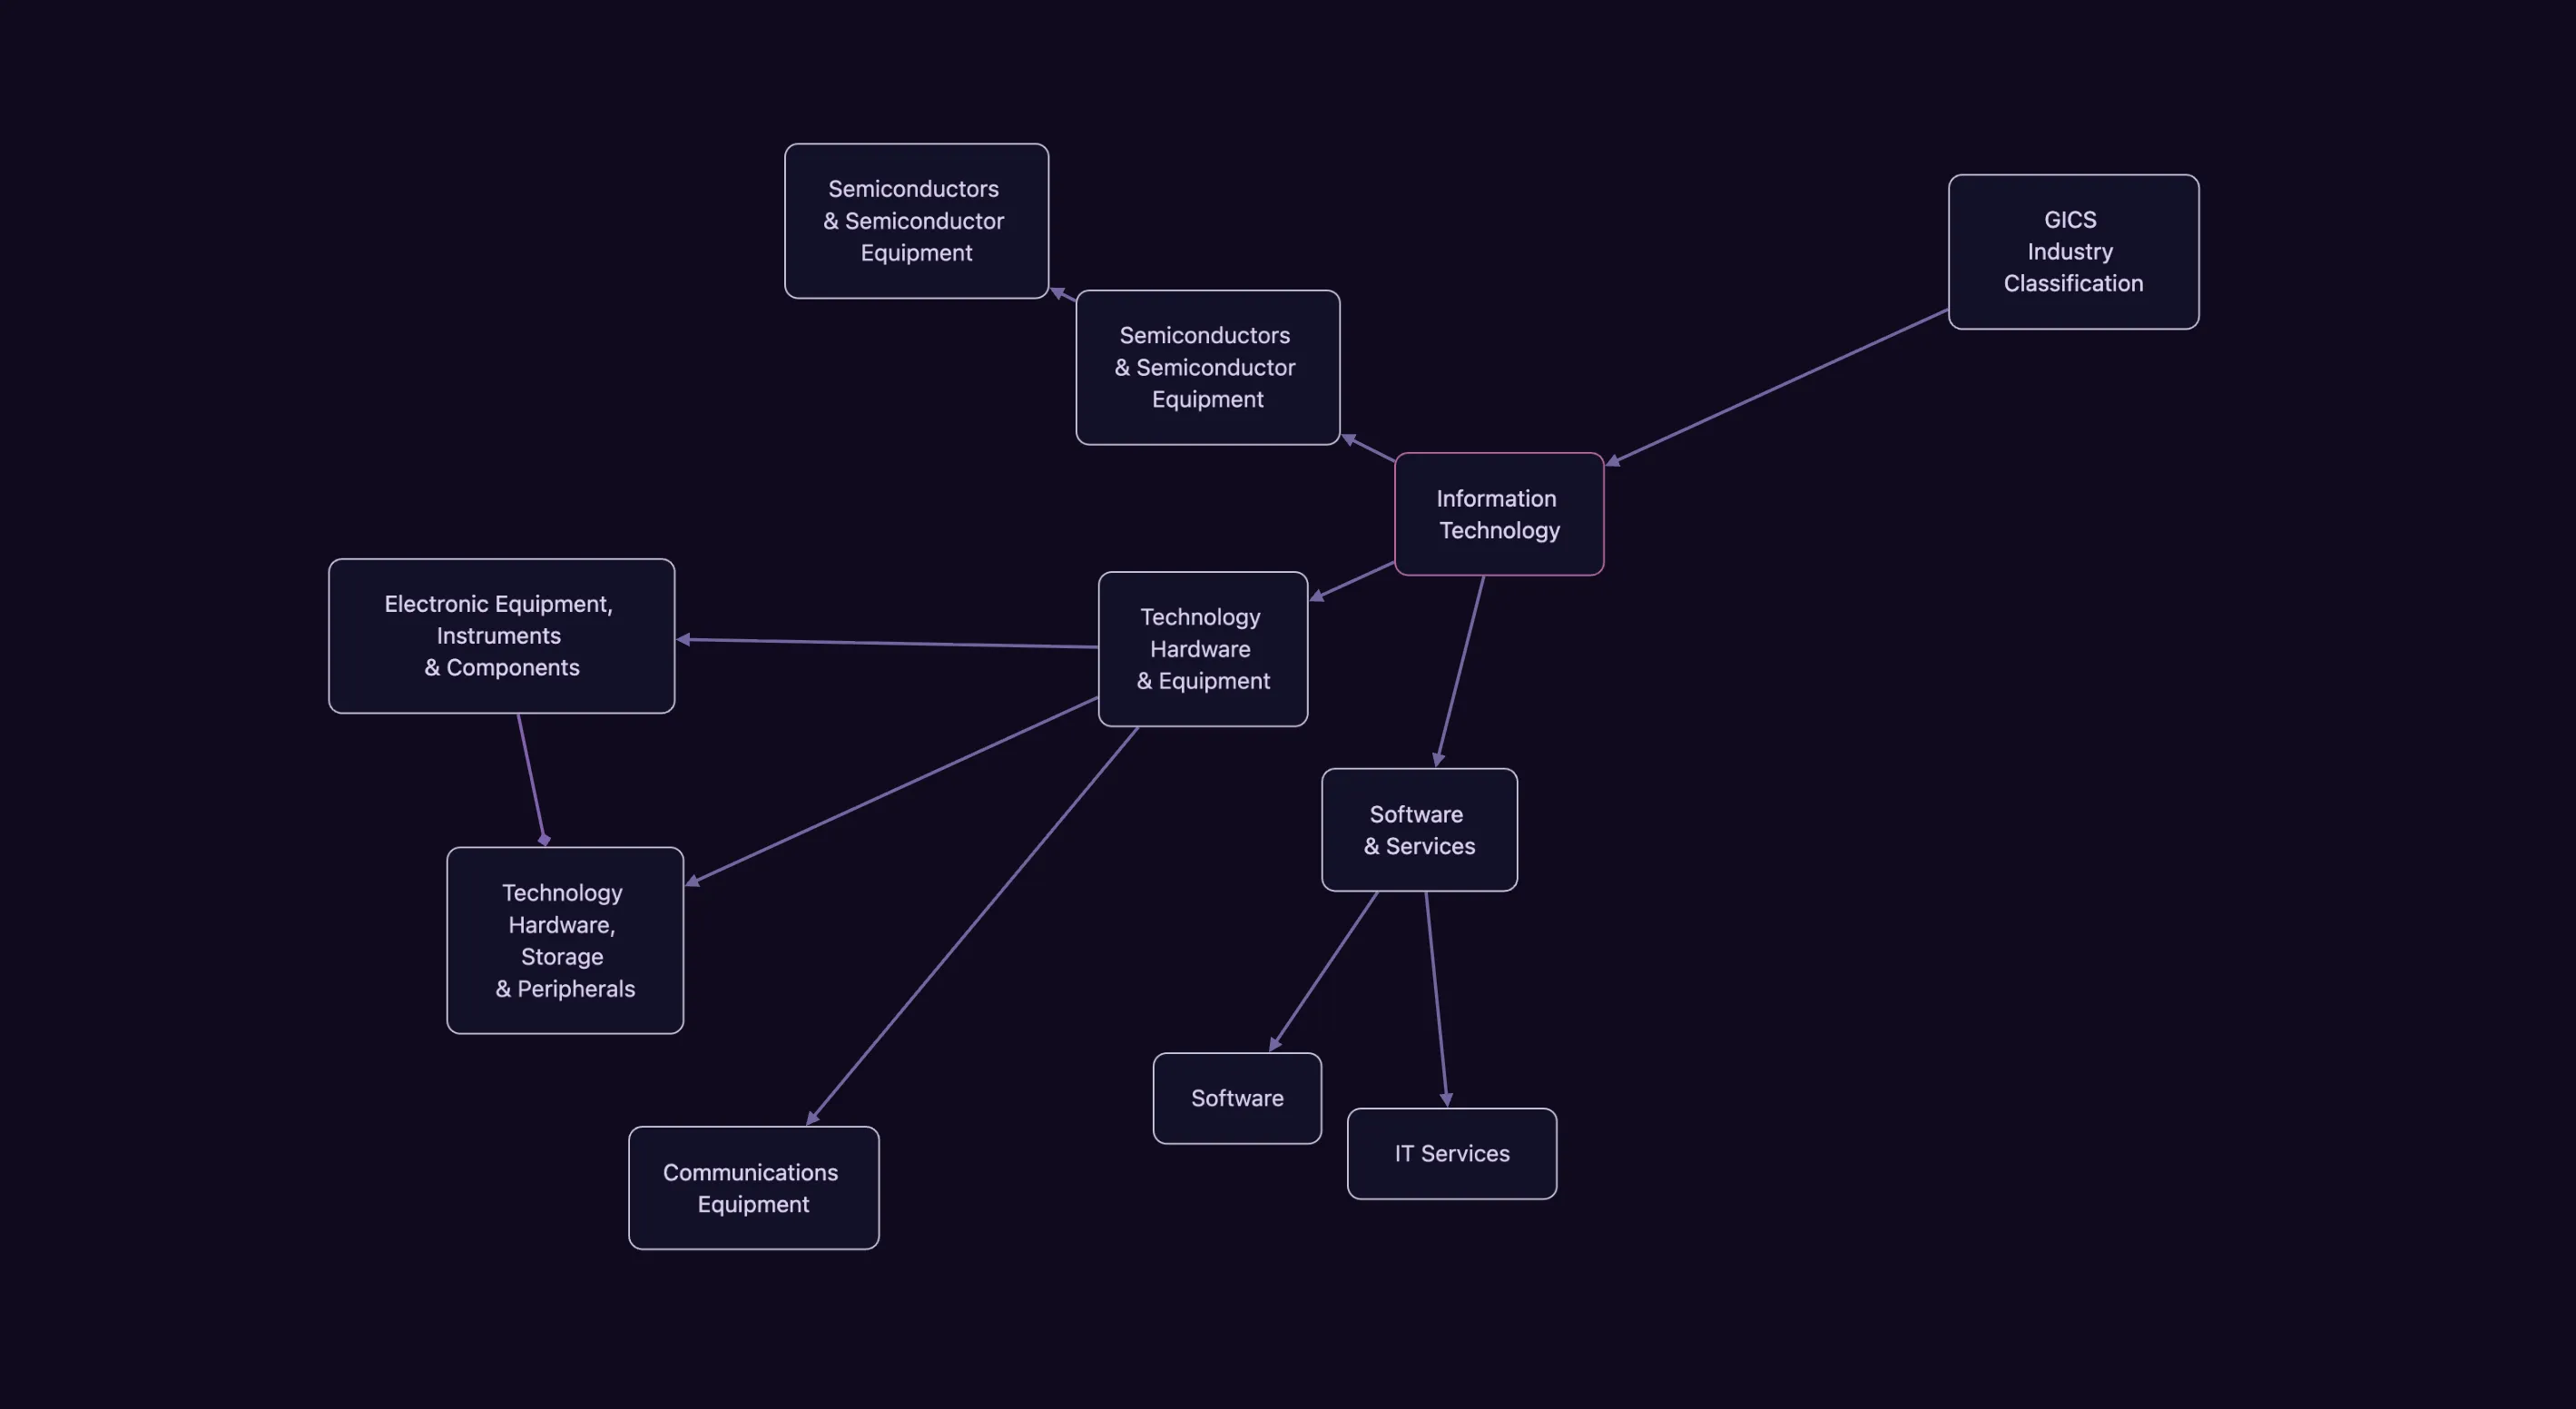
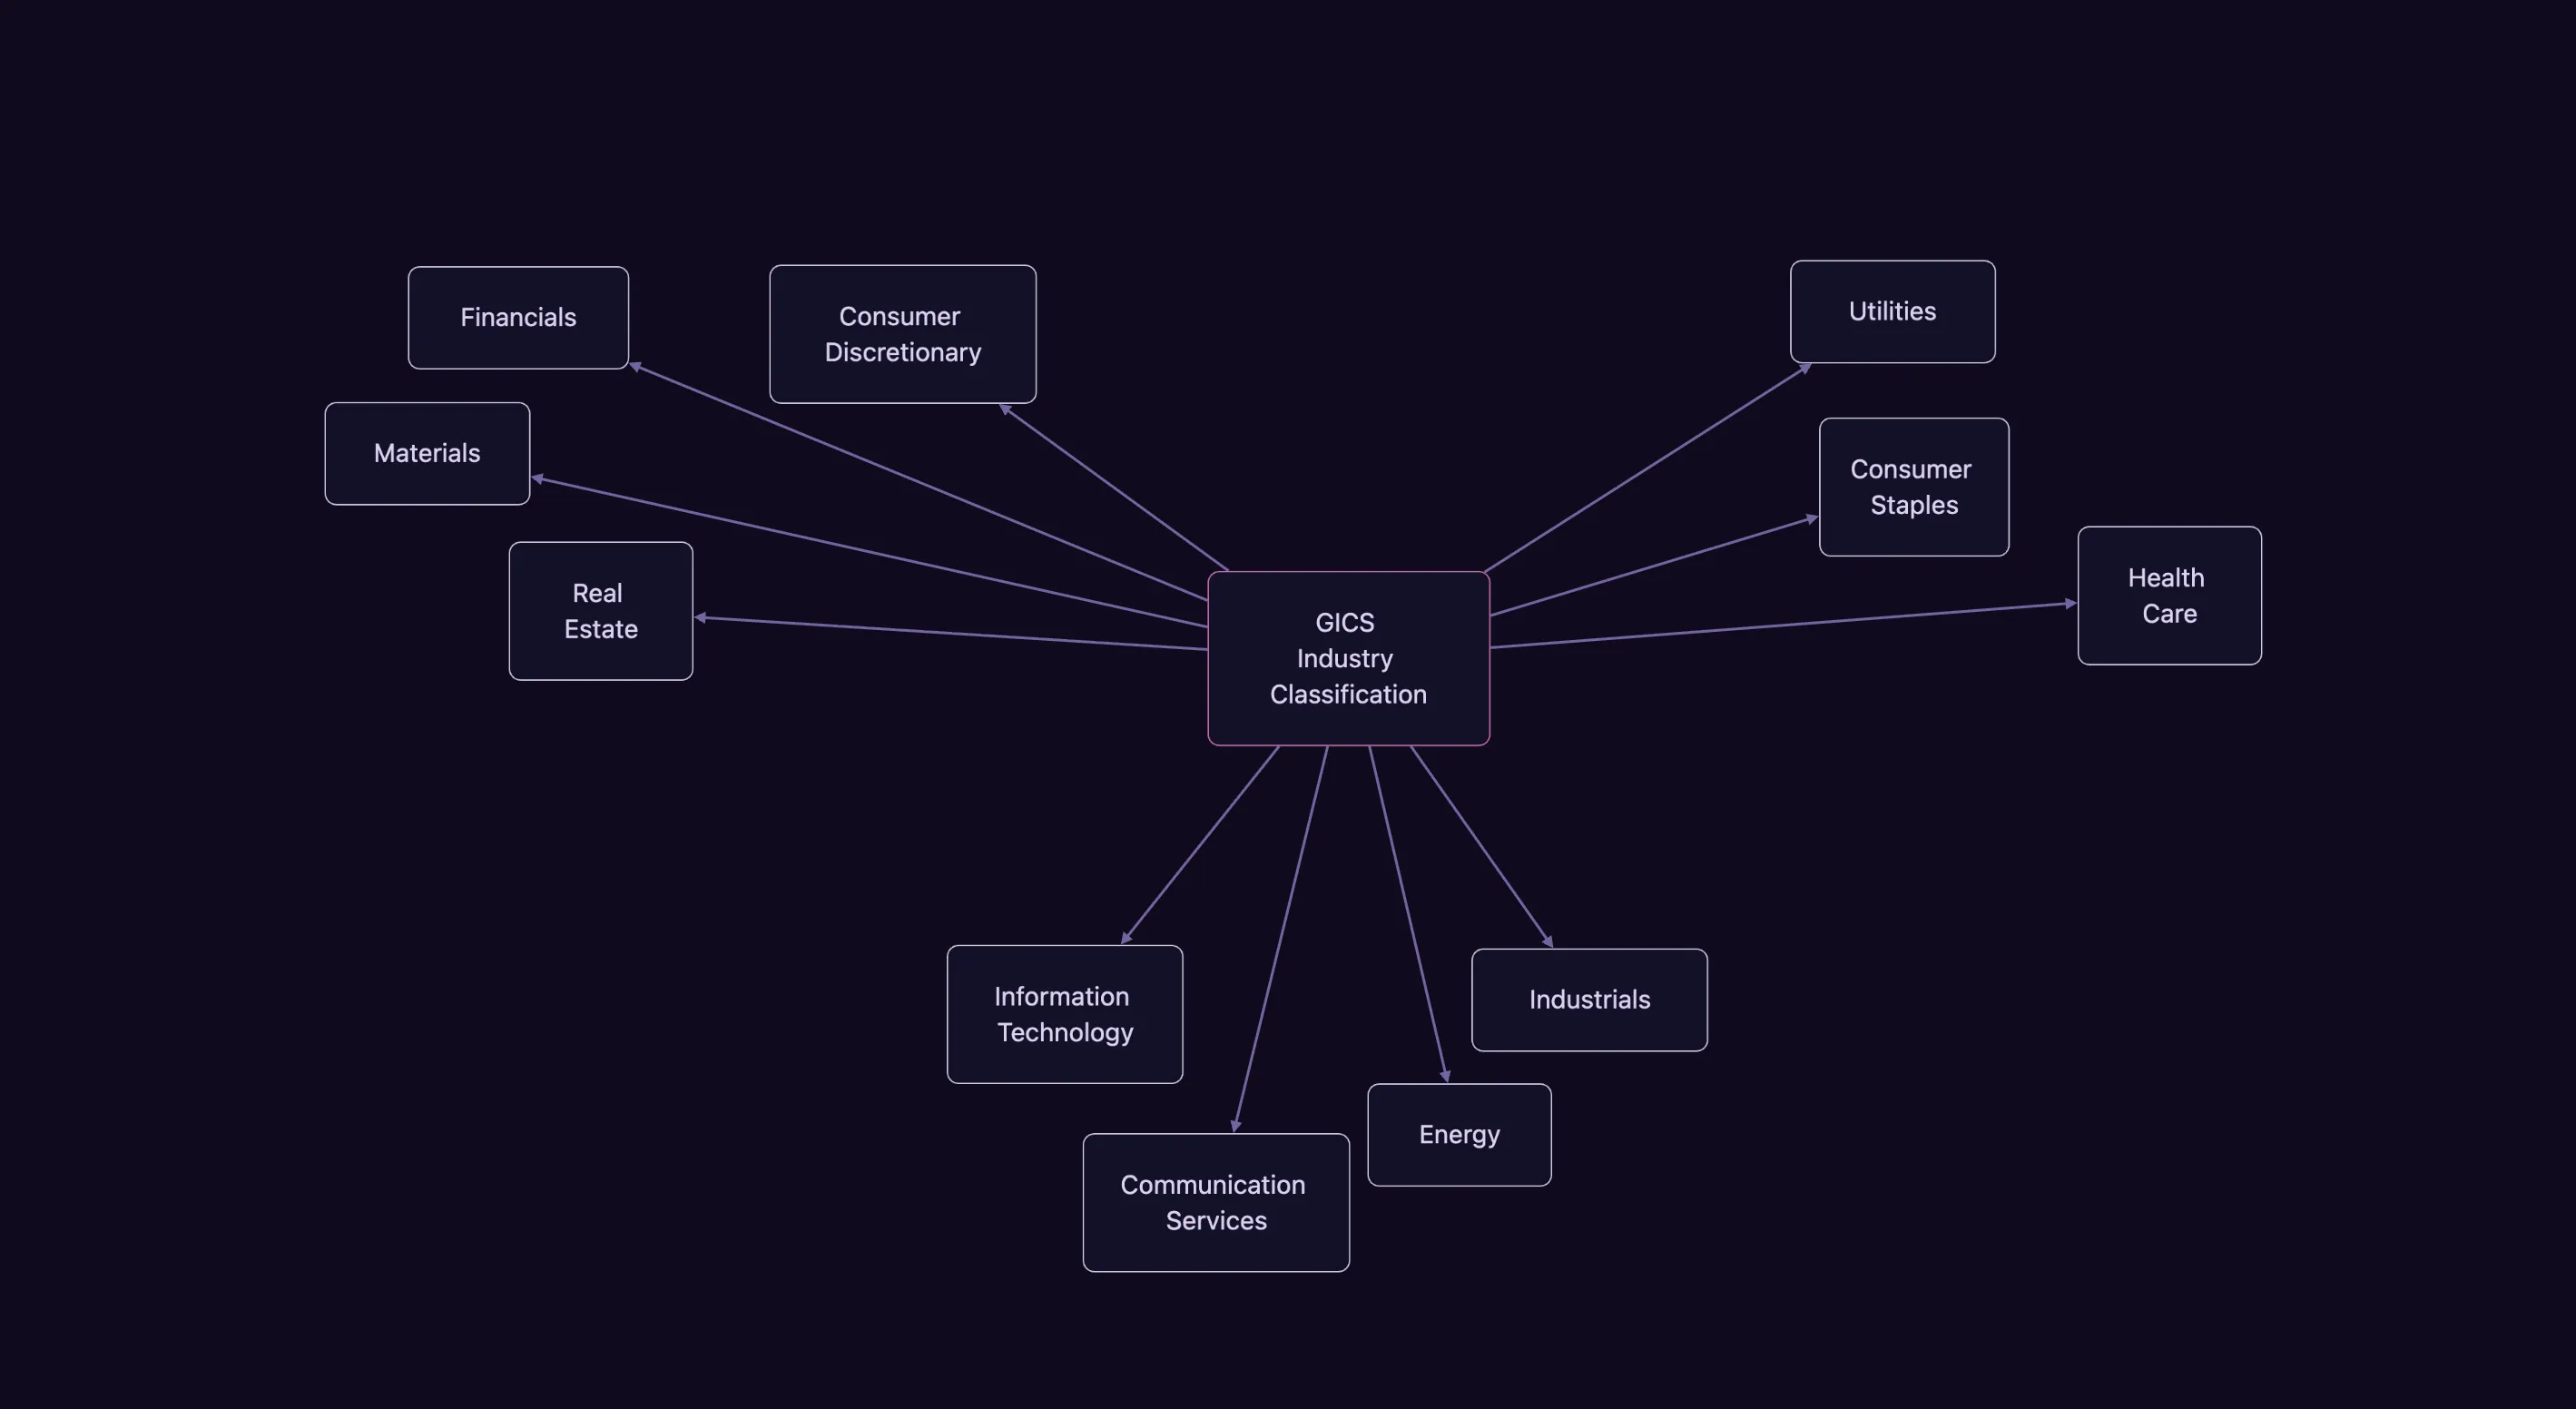
The full GICS hierarchy as a navigable tree — eleven sectors branching down through industry groups and industries to the eight-digit sub-industries, every node carrying its code. The classification that index construction and sector analysis are built on, laid out so you can see what sits beside what instead of looking up one code at a time.
There's no company here. No roadmap signed off by anyone, no growth team, no quarterly
anything — just a tool, a handful of maps, and the suspicion that knowledge deserves
better than a folder tree and a chat window.
If you want to build knowledge graphs and put them in front of people — for the love of
the subject, for your students, or as something you sell — come and do it. Same if
you'd rather work on Knogra itself.